M5 chart of EUR/USD
EUR/USD did not show any interesting movements on Wednesday. The euro is still trading near its local highs and cannot enter a bearish correction. Even without any fundamental and macroeconomic background, traders do not wish to lock in profits on long positions, which would lead to at least a small pullback down. Thus, the uptrend persists, as the price continues to be above the Ichimoku indicator lines. The upward movement looks more sideways, but at the same time, there is a slight upward bias. The nature of the movement isn't the best right now. Not much action this week either, but there will be three central bank meetings next week. Maybe this is one of the reasons why traders are being cautious right now.
There were three trading signals yesterday. All of them were in the area of 1.0845-1.0868. The movement itself was very weak, so the pair could not go even 15 pips in the right direction for the first two times. Therefore, you should have opened only one long position. You could earn using that one position since there were no sell signals by the end of the day. You could manually close the long position in the evening, which brought a profit of about 30 pips.
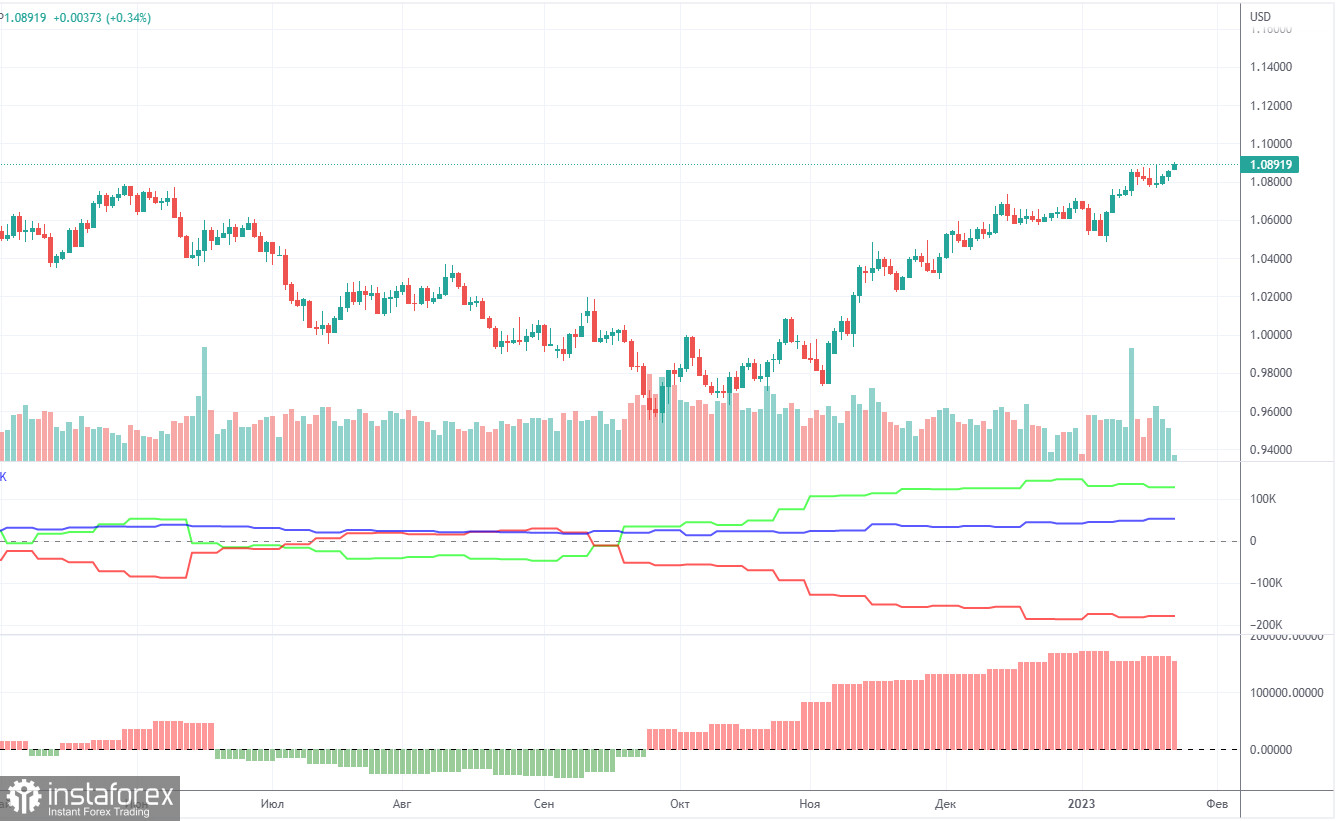
COT report
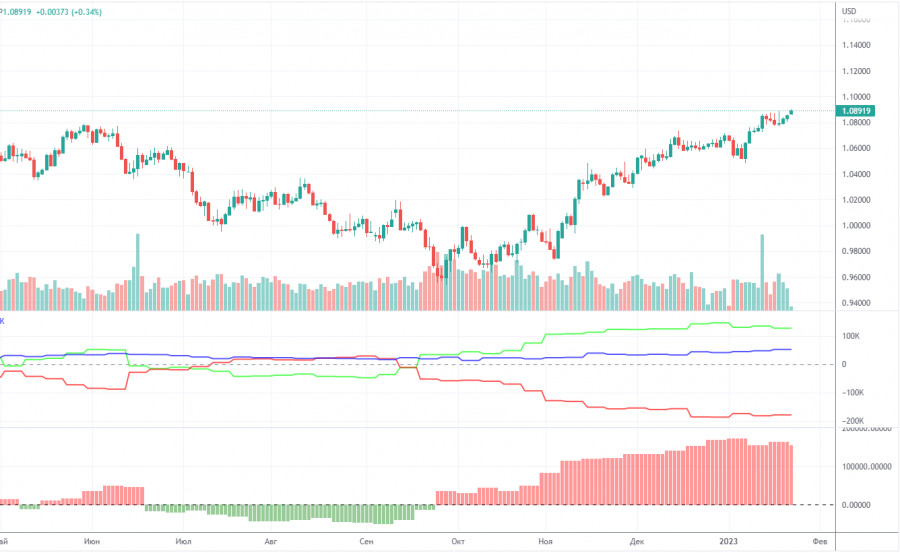
The COT reports for the euro in the last few months have been fully consistent with what is happening in the market. You can clearly see on the chart that the net position of big players (the second indicator) has been growing since early September. Around the same time, the euro started to grow. At this time, the net position of the non-commercial traders has been bullish and strengthens almost every week, but it is a rather high value that allows us to assume that the uptrend will end soon. Notably, the green and red lines of the first indicator have moved far apart from each other, which often precedes the end of the trend. During the given period, the number of long positions held by non-commercial traders decreased by 10,300, whereas the number of short positions fell by 2,300. Thus, the net positions decreased by 8,000. Now the number of long positions is higher than the number of short positions opened by non-commercial traders by 127,000. From a technical perspective, a bearish correction should have started a long time ago. In my opinion, this process can not continue for another 2 or 3 months. Even the net position indicator shows that we need to "unload" a bit, that is, to correct. The overall number of short orders exceeds the number of long orders by 52,000 (711,000 vs. 659,000).
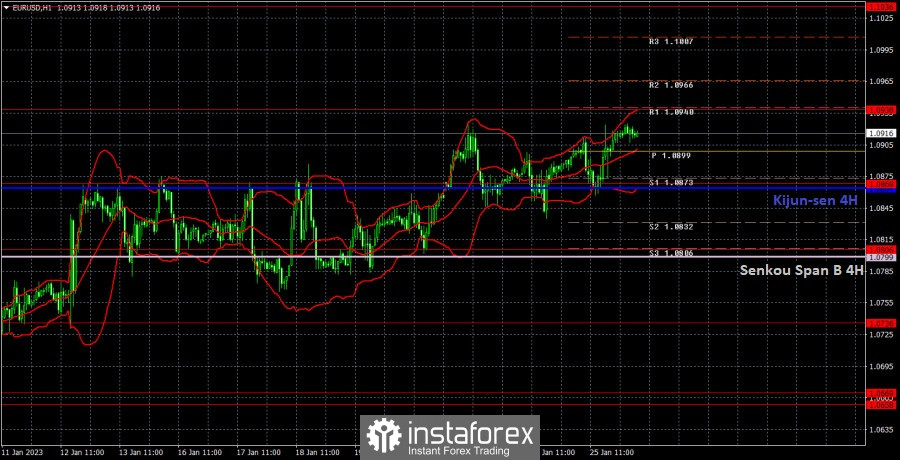
H1 chart of EUR/USD

The technical picture on the one-hour chart remains unchanged. We can see that the pair maintains the bullish sentiment, located above the lines of the Ichimoku indicator. Therefore, the euro will probably continue its upward movement in the near future, despite the flat last week. As we can see, there is still no way for the euro to correct, and traders prefer to buy the pair or not to do anything at all. On Thursday, the pair may trade at the following levels: 1.0658-1.0669, 1.0736, 1.0806, 1.0868, 1.0938, 1.1036, 1.1137 and also Senkou Span B lines (1.0799) and Kijun Sen (1.0864). Lines of the Ichimoku indicator may move during the day, which should be taken into account when determining trading signals. There are also support and resistance levels, but signals are not formed near these levels. Bounces and breakouts of the extreme levels and lines could act as signals. Don't forget about stop-loss orders, if the price covers 15 pips in the right direction. This will prevent you from losses in case of a false signal. No major events or reports in the European Union. Meanwhile, we have the relatively important GDP report and durable goods data in the US. Under certain circumstances, the market reaction might follow that data. But if in fact the values and forecasts coincide, it will be minimal.
What we see on the trading charts:
Price levels of support and resistance are thick red lines, near which the movement may end. They do not provide trading signals.
The Kijun-sen and Senkou Span B lines are the lines of the Ichimoku indicator, moved to the one-hour chart from the 4-hour one. They are strong lines.
Extreme levels are thin red lines from which the price bounced earlier. They provide trading signals.
Yellow lines are trend lines, trend channels, and any other technical patterns.
Indicator 1 on the COT charts reflects the net position size of each category of traders.
Indicator 2 on the COT charts reflects the net position size for the non-commercial group.