Details of the economic calendar on January 31
Data on the UK lending market turned out to be noticeably worse than forecasts. The number of approved mortgage loans amounted to 35,600 from last month's 46,200. The estimated figure was 45,000. Mortgage lending amounted to £3.24 billion against £4.26 billion in the previous month. The estimated volume was £4.0 billion. Recall that mortgage lending is directly related to the real estate market, which is an important sector of the British economy.
Due to poor reporting, the pound sterling came under pressure.
The main event on Tuesday was the preliminary estimate of GDP in the EU for the fourth quarter. Economic growth rate was estimated to slow down to 1.6%, but actual data came at 1.9%. A slight divergence played into the hands of the euro buyers, but it was only a local price manifestation.
Analysis of trading charts from January 31
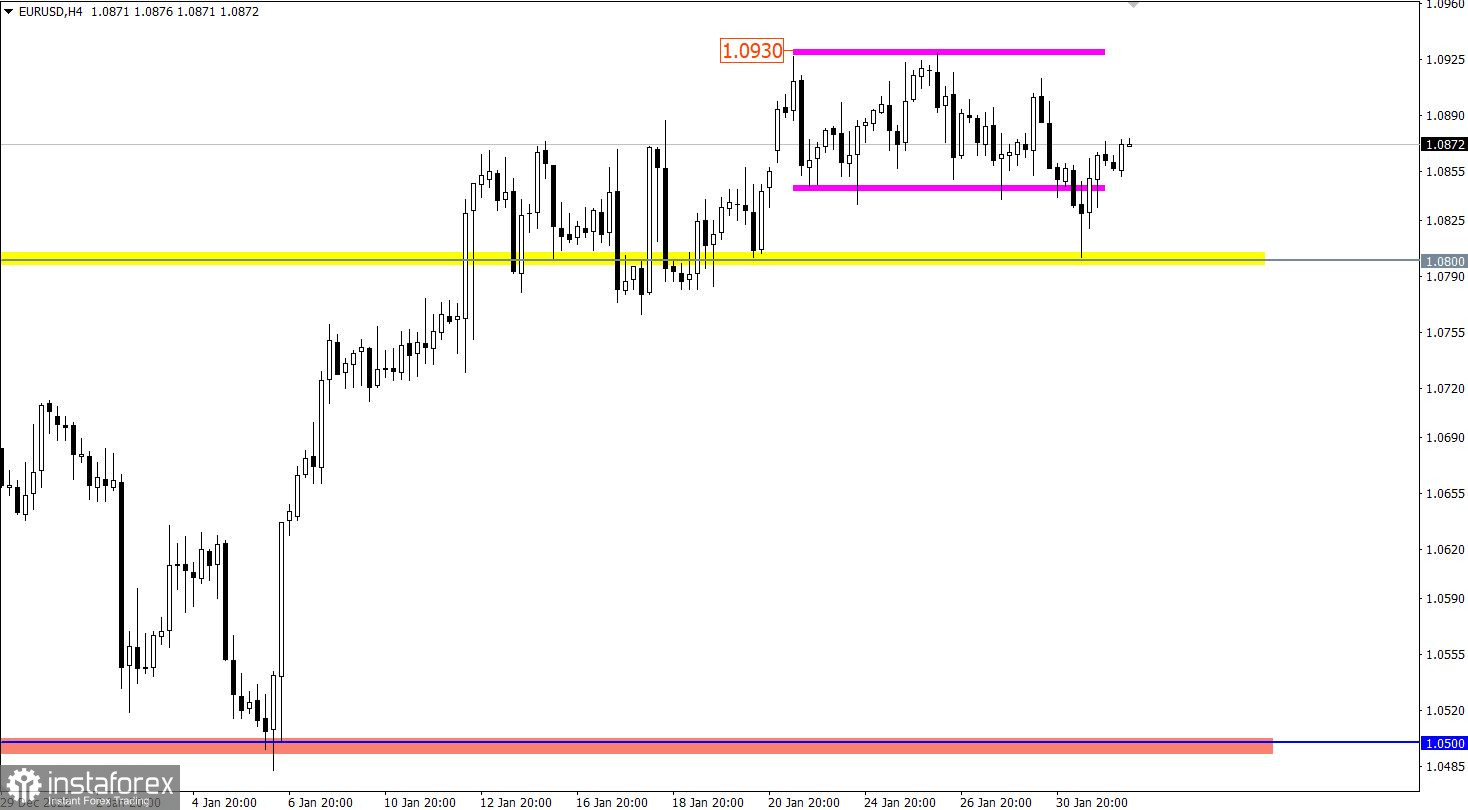
The EURUSD currency pair reached the 1.0800 support level during the downward activity. This price move led to the transition from the flat stage to a full-blown correction. However, this did not lead to anything drastic. The euro is still in an upward trend cycle.
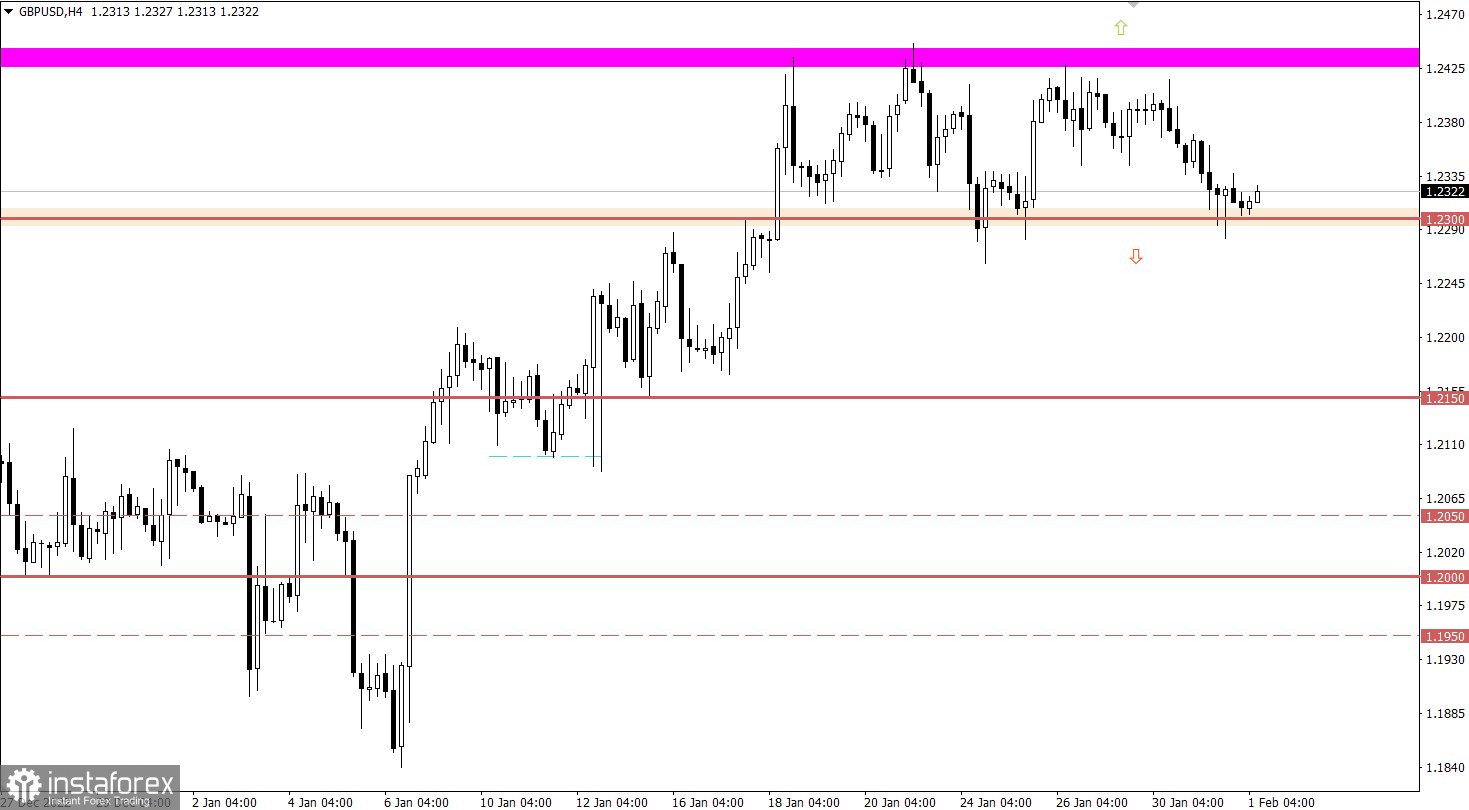
The GBPUSD currency pair, with surgical precision, slowed down the downward cycle in the area of the lower boundary of the 1.2300/1.2440 side channel. This step led to a reduction in short positions on the pound sterling, which almost immediately confirmed by price stagnation.
Economic calendar for February 1
Initially, preliminary data on inflation in the EU will be published, which may well fall from 9.2% to 8.7%, the consensus forecast is 9.0%. This is a positive economic signal that could well indicate a halt to interest rate hikes.
The main event of the week is the Federal Open Market Committee meeting, the results of which will be known later today. There is practically no doubt that, following its results, the interest rate will be increased from 4.50% to 4.75%. The market is already ready for this, so the subsequent comments of Fed Chairman Jerome Powell will be of the greatest interest. If Powell hints at a possible start of a rate cut before the end of this year, the U.S. dollar will instantly begin to fall in price, and U.S. stock indices will rush up. If nothing like this happens, events will develop according to a completely different scenario—the dollar will strengthen, and stock indices will decline.
Time targeting:
EU inflation – 10:00 UTC
Fed meeting results – 19:00 UTC
Fed press conference – 19:30 UTC
EUR/USD trading plan for February 1
The reduction in the volume of short positions within the level of 1.0800 led to a price rebound. As a result, the euro exchange rate again moved to growth, winning back most of the recent decline.
Today, much will depend on the information and news flow, particularly the speech of the head of the Fed. This event will definitely attract a lot of attention from speculators, which will lead to price spikes depending on Powell's rhetoric.
From a technical analysis point of view, holding the price above 1.0930 will lead to a prolonged upward trend. While the breakdown of the level of 1.0800 allows the subsequent formation of a correction in the euro.
GBP/USD trading plan for February 1
As long as there is no breakdown of one or another flat boundary, a price rebound scenario is allowed, which in the theory of technical analysis, can lead to a reverse move towards the border of 1.2440.
The breakdown method is rightfully considered the main tactic, because only it will lead to drastic changes relative to the current stagnation.
What's on the charts
The candlestick chart type is white and black graphic rectangles with lines above and below. With a detailed analysis of each individual candle, you can see its characteristics relative to a particular time frame: opening price, closing price, intraday high and low.
Horizontal levels are price coordinates, relative to which a price may stop or reverse its trajectory. In the market, these levels are called support and resistance.
Circles and rectangles are highlighted examples where the price reversed in history. This color highlighting indicates horizontal lines that may put pressure on the asset's price in the future.
The up/down arrows are landmarks of the possible price direction in the future.