Yesterday was not a very good day for trading. Let us take a look at the 5-minute chat to clear up the market situation. Earlier, I asked you to pay attention to the level of 1.0874 to decide when to enter the market. A rise and false breakout of this level led to a sell signal. However, closer to the middle of the day, it became obvious that bears would not gain control over the market. The eurozone inflation report unveiled a slowdown but failed to affect the market. A breakout and a downward test of 1.0874 forced traders to close sell orders and open the long ones. Before the Fed's meeting, the euro did not show a significant rise. In the second part of the day, there was no good entry point.
Conditions for opening long positions on EUR/USD:
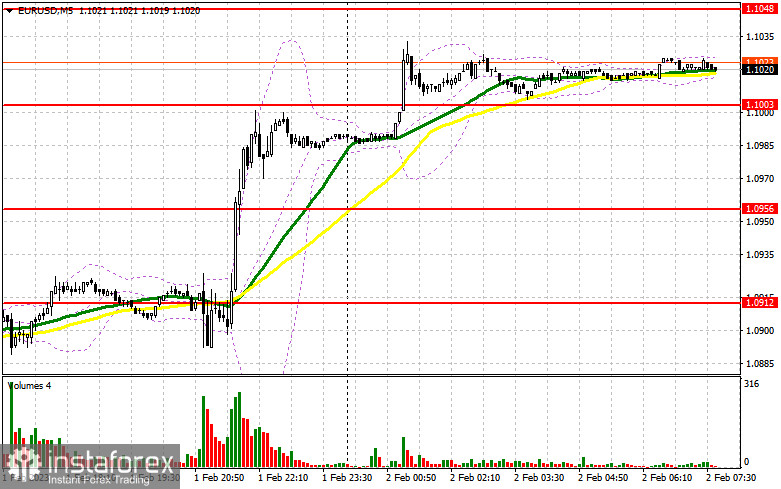
It was quite expectable that the Fed would raise the benchmark rate by 0.25%. However, Jerome Powell's announcement about just several key rate hikes in the future encouraged buyers of the euro and led to a depreciation of the US dollar. Today, the currency may suffer even more. The fact is that the ECB may raise the key interest rate by 0.5%. If Christine Lagarde signals further monetary policy tightening, the euro may add another 200 pips before the bullish rally stops. If the regulator switches to a less hawkish stance like the Fed, pressure on risk assets, including the euro, will return. If the euro declines during the European session, traders may go long only after a false breakout near a new support level of 1.1003. The target will be located at 1.1048. A breakout and a downward test of this level will give an additional long signal with the target at 1.1089. A breakout of this level will affect bears' stop orders and allow the pair to climb to 1.1125, where it is better to lock in profits. However, the pair will show such a dynamic only in case of the very aggressive stance of the ECB. Since yesterday's inflation report unveiled a slowdown, I doubt that the ECB will continue to damage the economy without strong reasons. If the euro/dollar pair declines and buyers fail to protect 1.1003 in the first part of the day, the euro may slide even deeper. The fact is that a drop below this level will affect buyers' stop orders. Traders are likely to focus on the support level of 1.0956, where there are bullish MAs. Only a false breakout will lead to a buy signal. It is also possible to go long after a bounce off the low of 1.0912 or even lower – from 1.0860, expecting a rise of 30-35 pips.
Conditions for opening short positions on EUR/USD:
Yesterday, bears were active but all in vain. They will have a chance to enter the market only if the ECB switches to a looser stance. There are no other reasons for the euro's correction. Now, bears should regain control over the level of 1.1003 formed yesterday. Only this will push the price lower and put it under pressure. However, sellers should primarily protect the resistance level of 1.1048. The pair is highly likely to test it today. If the euro/dollar pair jumps during the European session after the ECB announces its decision on the key rate, an unsuccessful consolidation above this level will lead to a short signal and a decline to 1.1003. A breakout and a reverse test of 1.1003 will give an additional sell signal with the target at 1.0956. A settlement below this level will cause a deeper decline to 1.0912, where it is recommended to lock in profits. If the euro/dollar pair increases during the European session and bears fail to protect 1.1048, the bullish trend will develop. In the event of this, traders should avoid selling until the price hits 1.1089. There, it will possible to go short only after an unsuccessful settlement. Traders may also open sell orders just after a rebound from the high of 1.1125, expecting a decline of 30-35 pips.
COT report
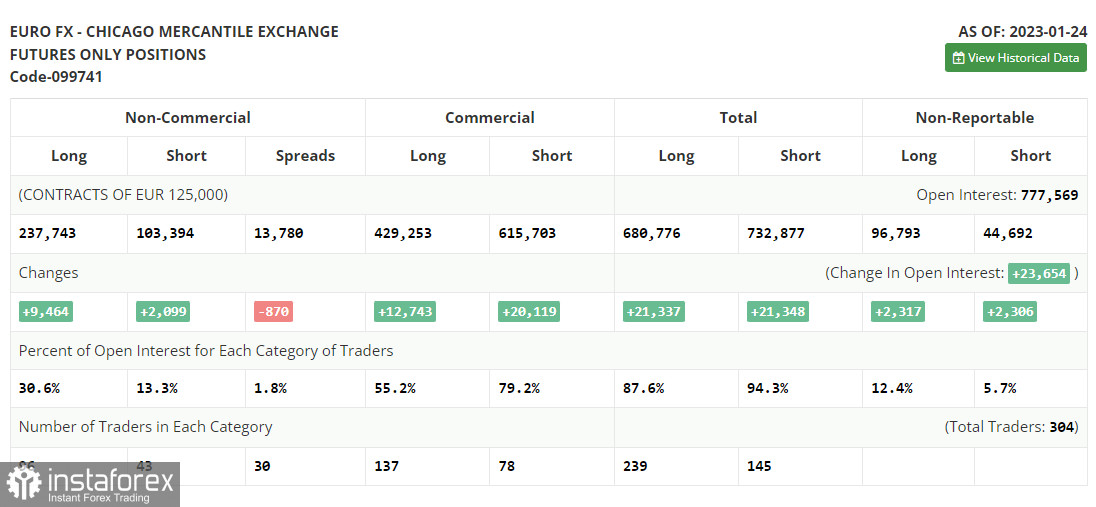
According to the COT report for January 24, the number of both short and long positions increased. Apparently, traders were encouraged by the ECB statement last week and continued to open more long positions on the pair. They now expect the ECB to maintain its aggressive approach, while the Fed could ease its monetary tightening. The US regulator may slacken the pace of the key rate hike for the second time in a row. The recent downbeat data on the US economy, in particular, a drop in retail sales and the easing of inflationary pressure may be a signal for the Fed to loosen its grip on the economy to avoid any damage. This week, the main central banks will hold their meetings, which will determine the trend of the euro/dollar pair. The COT report unveiled that the number of long non-commercial positions increased by 9,464 to 237,743 while the number of short non-commercial positions surged by 2,099 to 103,394. At the end of the week, the total non-commercial net position rose to 134,349 from 126,984. This means that investors believe in the euro's upside potential but are looking for more hints from central banks about interest rates. The weekly closing price advanced to 1.0919 from 1.0833.
Signals of indicators:
Moving Averages
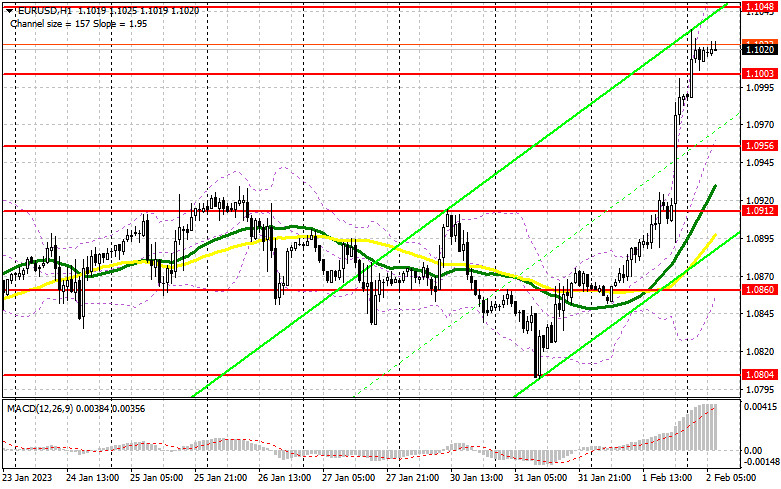
Trading is performed above the 30- and 50-day moving averages, which points to a further rise in the euro.
Note: The author considers the period and prices of moving averages on the one-hour chart which differs from the general definition of the classic daily moving averages on the daily chart.
Bollinger Bands
If the pair increases, the resistance level will be formed by the upper limit of the indicator located at 1.1075. In case of a decline, the lower limit of the indicator located at 1.0860 will act as support.
Description of indicators
- Moving average (a moving average determines the current trend by smoothing volatility and noise). The period is 50. It is marked in yellow on the chart.
- Moving average (a moving average determines the current trend by smoothing volatility and noise). The period is 30. It is marked in green on the graph.
- MACD indicator (Moving Average Convergence/Divergence - convergence/divergence of moving averages). A fast EMA period is 12. A slow EMA period is 26. The SMA period is 9.
- Bollinger Bands. The period is 20.
- Non-profit speculative traders are individual traders, hedge funds, and large institutions that use the futures market for speculative purposes and meet certain requirements.
- Long non-commercial positions are the total number of long positions opened by non-commercial traders.
- Short non-commercial positions are the total number of short positions opened by non-commercial traders.
- The total non-commercial net position is a difference in the number of short and long positions opened by non-commercial traders.