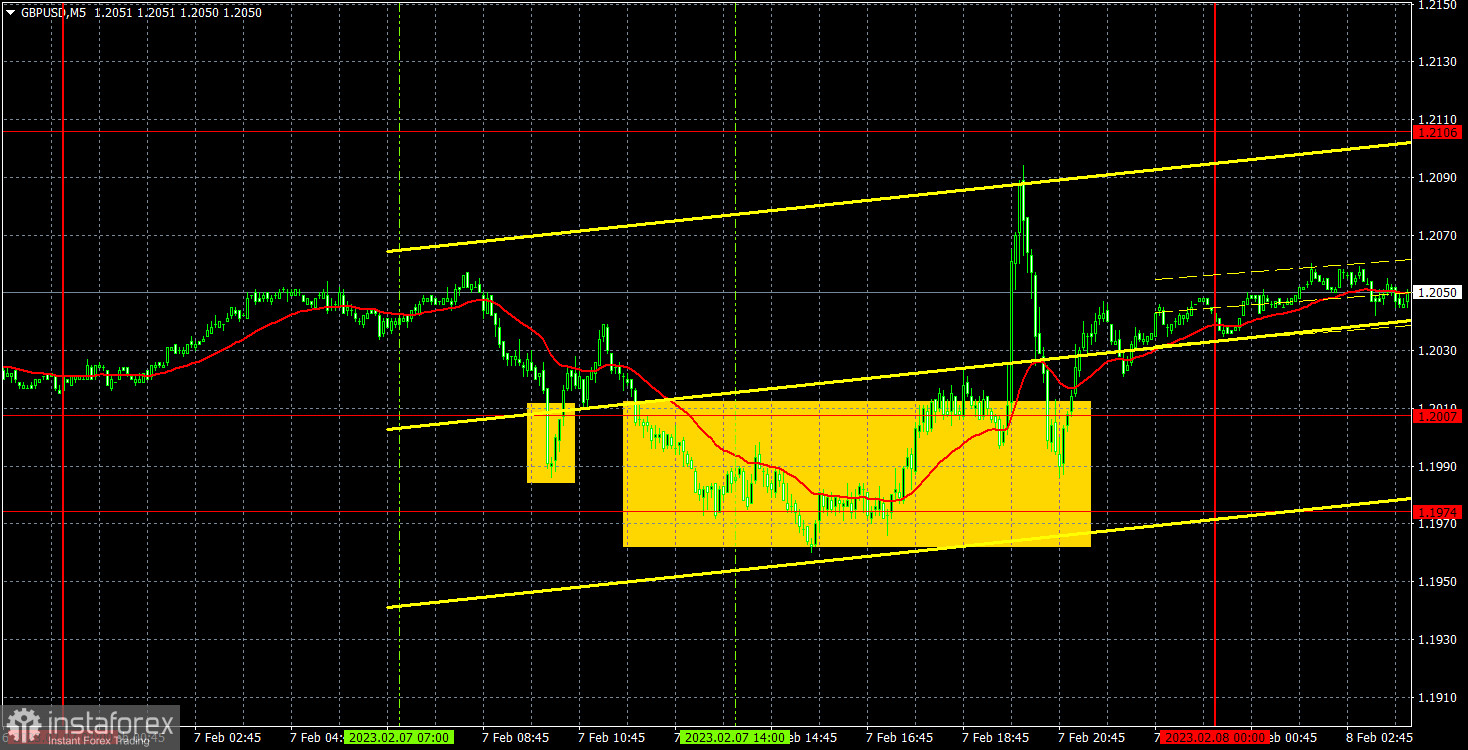
M5 chart of GBP/USD
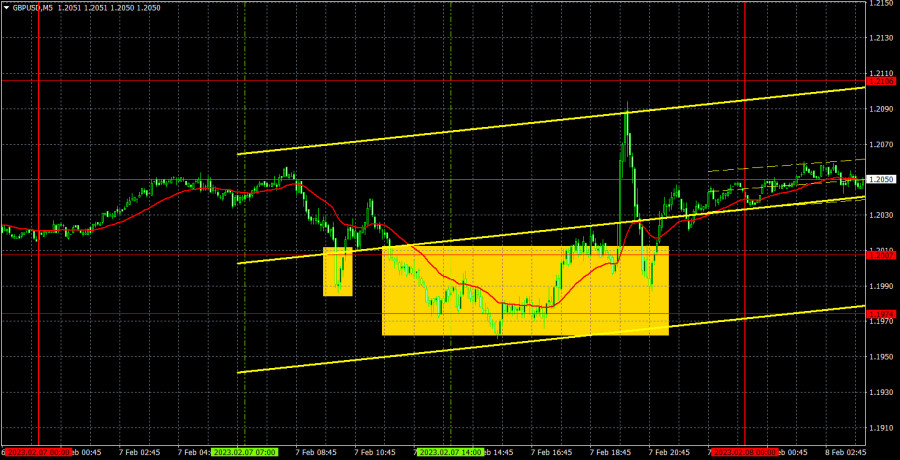
On Tuesday, GBP/USD also fell by momentum, but it stopped moving down in the evening. Federal Reserve Chairman Jerome Powell's speech, as I mentioned, was not very resonant, but the market reacted strongly to it, as if Powell announced something new. Perhaps, traders, as usual, were trying to find something they wanted in Powell's speech. Whether or not they found it is a complicated question. We took yesterday's "flight" philosophically: the pair should have started a bullish correction after the four-day plunge, and Powell's speech might have been just a pretext. There were no other important events or reports during the day, neither in the US nor in Britain. Therefore, the pair might continue its corrective movement till the end of the week, but it is still difficult for the pound to count on a strong growth. The technical formation of the Double Top pattern has not been worked out yet, and all factors in favor of the pound's growth have already been considered by the market.
Speaking of trading signals, the situation was ambiguous. The 1.1974-1.2007 area should be considered as an actual area, but the pair spent most of the day moving around it. Therefore, there were only two signals. During the European session, the price rebounded from this area and went up about 20 pips, which was a bit painful. The second bounce occurred when Powell's speech started. In the first case, the position was closed with Stop Loss at breakeven, in the second one, long positions should not have been opened because the signal was formed too late.
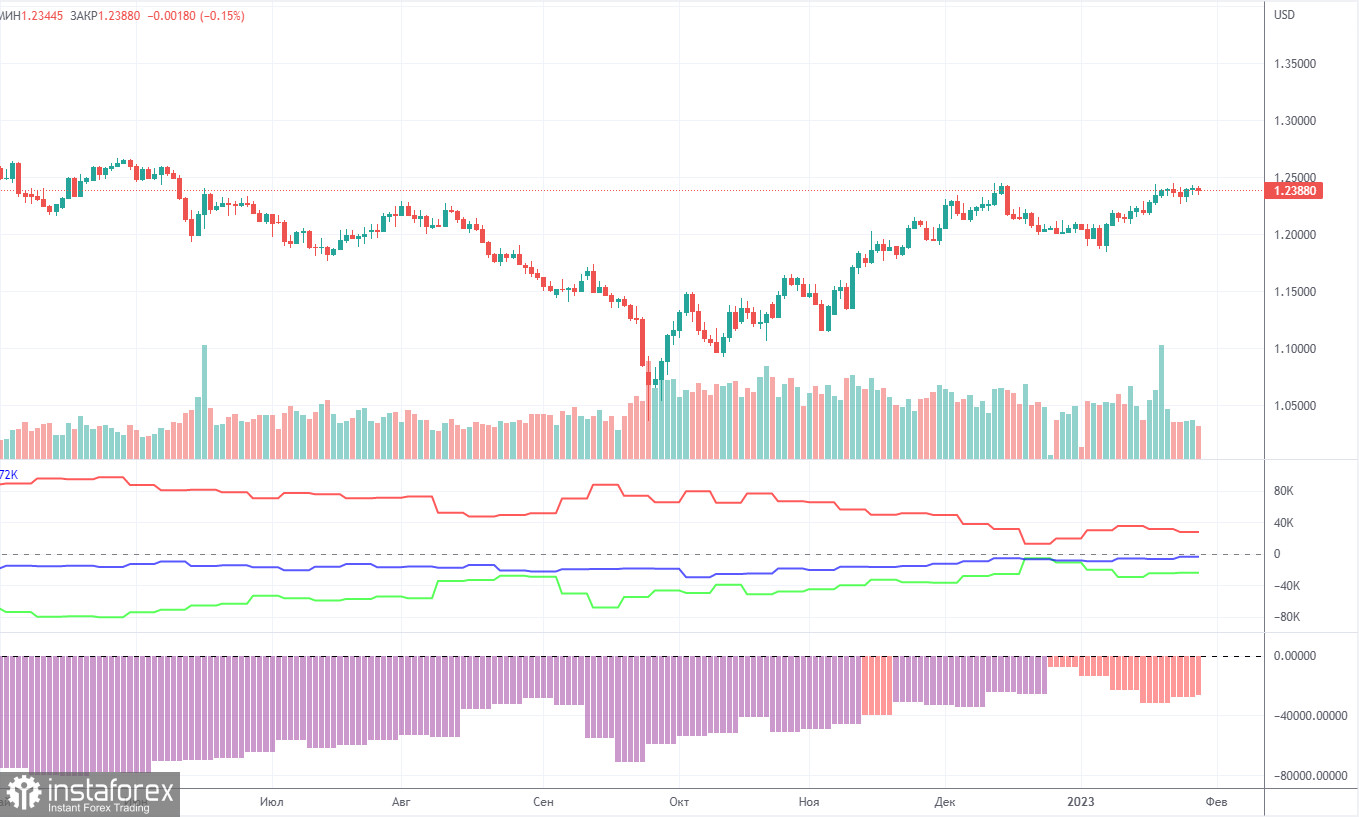
COT report
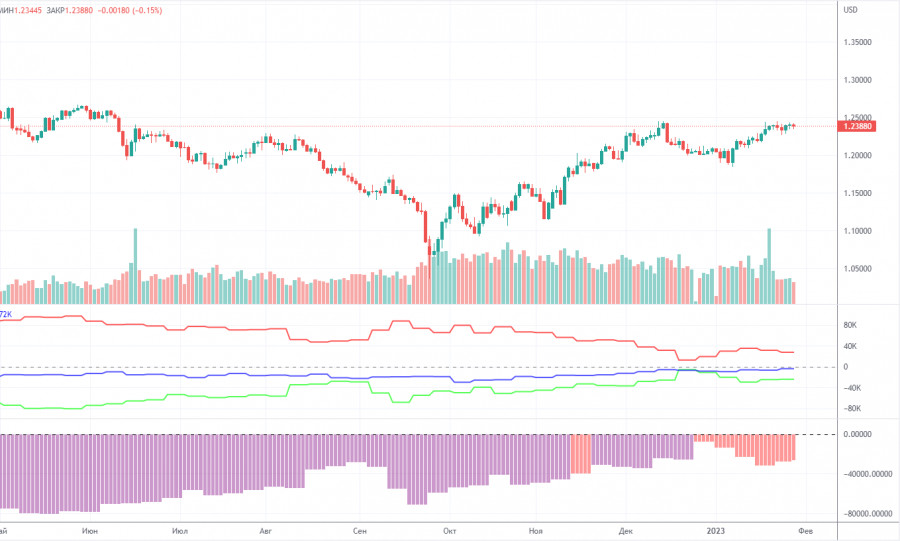
The recent COT report on the pound sterling unveiled that the bearish sentiment became weaker. During the week, non-commercial traders closed 6,700 long positions and 78,500 short ones. Thus, the net position of non-commercial traders increased by 800. During the last few months, the net position was increasing quite stably. The sentiment of big traders could become bullish in the near future. It is still very hard to explain why the pound sterling increased so much against the US dollar. In the mid-term, the British pound could drop as it needs correction. In general, the recent COT reports have been corresponding to the pound's movement. Since the net position is not bullish anymore, traders may buy the asset in the next few months. By the moment, non-commercial traders have opened 35,000 longs and 59,000 shorts. We do not expect long-lasting growth in the pound sterling. Although it has technical reasons for that, the fundamental and geopolitical factors do not presuppose a strong and fast increase.
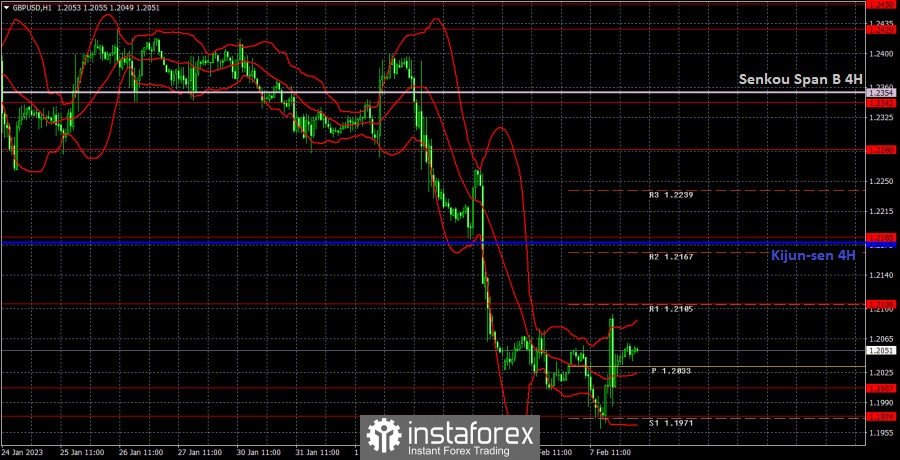
H1 chart of GBP/USD

On the one-hour chart, GBP is still falling, but it hasn't crossed the important 1.1974-1.2007 support area, so now a correction can start. I don't expect the pair to climb above the Kijun-sen line in the next few days, the downtrend should persist since the price hasn't gone low enough after the last turn of strengthening, which took some months. And there are almost no support factors for the British currency now. On Wednesday, important levels are seen at: 1.1760, 1.1874, 1.1974-1.2007, 1.2106, 1.2185, 1.2288, 1.2342. The Senkou Span B (1.2354) and Kijun Sen (1.2178) lines can also be sources of signals. Pullbacks and breakouts through these lines may produce signals as well. A Stop Loss order should be set at the breakeven point after the price passes 20 pips in the right direction. Ichimoku indicator lines may move during the day, which should be taken into account when determining trading signals. In addition, the chart does illustrate support and resistance levels, which could be used to lock in profits. On Wednesday, there are no important events planned in Britain and the US. The only thing that will take place is a series of speeches by representatives of the Fed's monetary committee. They could make significant comments, but they are unlikely to be so important that the market will react the same way it did yesterday to Powell's speech.
What we see on the trading charts:
Price levels of support and resistance are thick red lines, near which the movement may end. They do not provide trading signals.
The Kijun-sen and Senkou Span B lines are the lines of the Ichimoku indicator, moved to the one-hour chart from the 4-hour one. They are strong lines.
Extreme levels are thin red lines from which the price bounced earlier. They provide trading signals.
Yellow lines are trend lines, trend channels, and any other technical patterns.
Indicator 1 on the COT charts reflects the net position size of each category of traders.
Indicator 2 on the COT charts reflects the net position size for the non-commercial group.