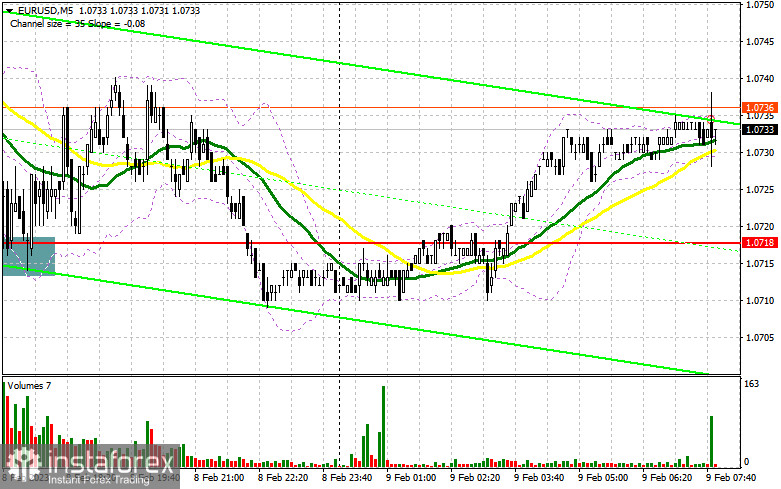
Yesterday, there was only one entry point. Now, let's look at the 5-minute chart and figure out what actually happened. In my morning article, I turned your attention to 1.0764 and recommended making decisions with this level in focus. Despite a slight rise in the euro in the morning, it failed to reach 1.0764. The pair lacked just a w few pips to generate a good entry point into short positions. In the afternoon, the bulls managed to protect the support level of 1.0718 against the background of low market volatility and a slight decline in the euro. It provided a new buying opportunity. However, the pair rose by only 20 pips.
When to open long positions on EUR/USD:
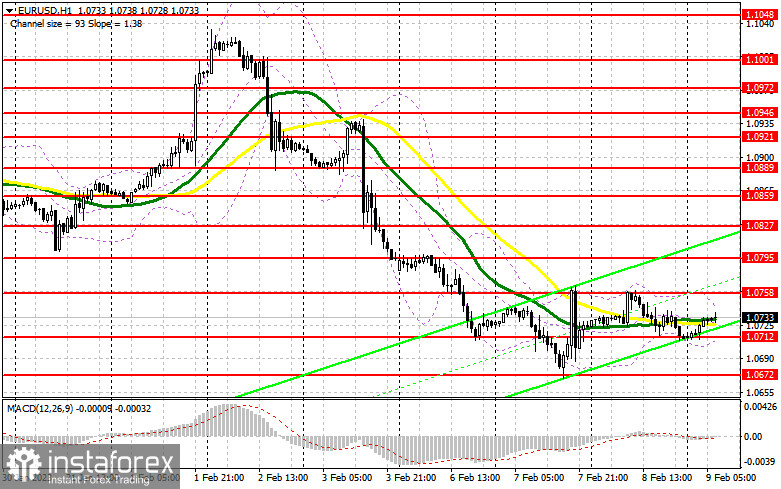
As widely expected, the speeches of Fed policymakers limited the upside potential of the pair yesterday. However, their impact was not significant as Fed officials did not say anything new. Their comments were similar to Jerome Powell's speech. Today, in the morning, the Consumer Price Index for Germany is on tap. This report may boost the euro provided that the reading exceeds expectations. Soaring inflation in Germany will force the European Central Bank to fulfill its recent promises to stick to aggressive tightening. The economic forecast from the European Commission is unlikely to affect the euro. However, the upward revision of GDP as well as hawkish statements by ECB Governing Council Member Joachim Nagel could also stimulate a bullish bias. If the pressure on the pair returns in the morning, the bulls will surely try to push the price to 1.0712, the middle of the sideways channel. Only after a false breakout of this level, similar to the one I have mentioned above, a buy signal will appear. The price may grow to 1.0758. The moving averages are benefiting the bears below this level. A breakout and a downward retest of this level will give a new entry point in long positions with the prospect of a jump to 1.0795. A breakout of this level will also force the bears to close their Stop Loss orders. It could trigger an additional buy signal with the possibility of an increase to 1.0827 where I recommend locking in profits. However, the pair is unlikely to show robust growth today. If EUR/USD declines and buyers show no activity at 1.0712 in the morning, the pressure on the pair will remain. If the price tumbles below this level, it could make buyers close their Stop Loss orders. Bears are sure to return to the market. In this case, traders should shift their attention to the support level of 1.0672, which is the lower border of the sideways channel. Only a false breakdown there will give a buy signal. You could buy EUR/USD at a bounce from the low of 1.0618 or 1.0569, keeping in mind an upward intraday correction of 30-35 pips.
When to open short positions on EUR/USD:
It is better to go short at 1.0758, a new resistance level formed yesterday. Before opening short positions, I would advise you to make sure that large traders have entered the market. To do so, you should wait for a rise and a false breakout after mixed macro stats on the eurozone. It will give a sell signal with the aim of a decline to 1.0712, the middle of the sideways channel. A breakout and an upward retest of this level will provide a new selling opportunity with a decrease to 1.0672, which will only facilitate the downward correction for the pair. A dip below this level against the background of strong data on the US labor market may trigger a steeper decline to 1.0618. I recommend locking in profits there. If EUR/USD rises during the European session and bears show no energy at 1.0758, the bulls could try to regain the upper hand. In this case, I would advise you to postpone short positions until of a false breakout of 1.0795 You could sell EUR/USD at a bounce from a high of 1.0827, keeping in mind a downward intraday correction of 30-35 pips.
COT report
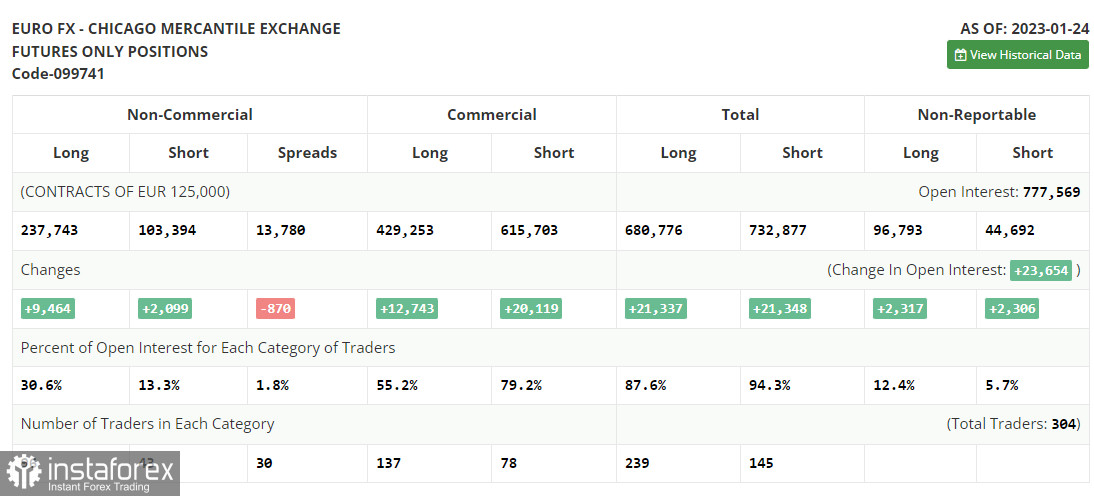
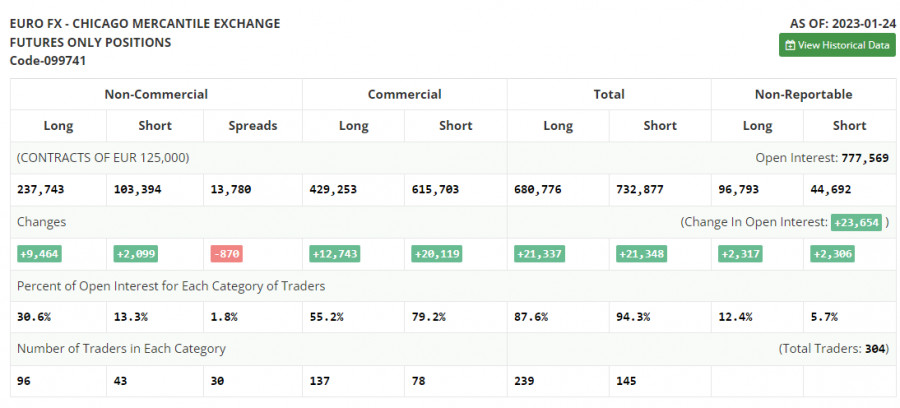
The COT report for January 24 logged a rise in both short and long positions. Traders have significantly increased long positions following hawkish speeches of ECB policymakers. They are betting on further monetary tightening by the ECB and the Fed's dovish stance. The US regulator may reduce the pace of tightening for the second time in a row. Weak macro stats on the US economy, namely a drop in retail sales and a slowdown in inflation may force the central bank to take a pause in rate hikes to avoid any damage. This week, several central banks will hold their meetings. Their results will eventually determine the trajectory of the euro/dollar pair. According to the COT report, the long positions of the non-commercial group of traders increased by 9,464 to 237,743 while short positions advanced by 2,099 to 103,394. At the end of the week, the total non-commercial net position rose to 134,349 from 126,984. It appears investors believe in the upside potential of the euro. Nevertheless, they are waiting for more clues from central banks regarding interest rates. The weekly closing price grew to 1.0919 from 1.0833.
Indicators' signals:
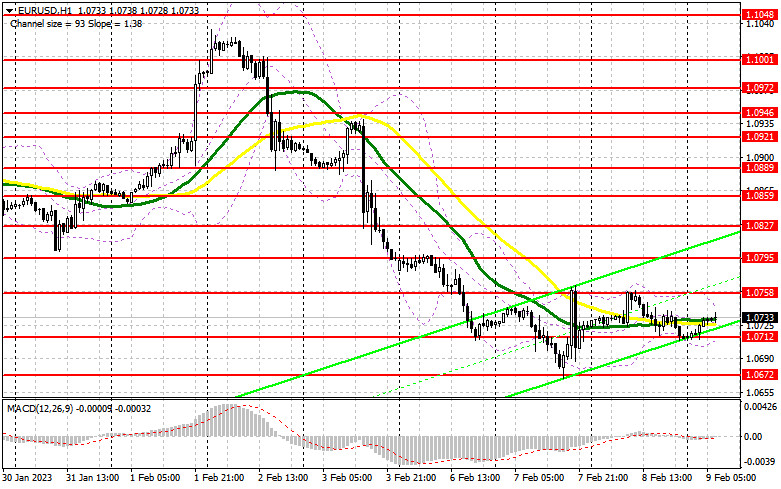
Trading is carried out near the 30 and 50 daily moving averages, which indicates market uncertainty.
Moving averages
Note: The period and prices of moving averages are considered by the author on the H1 (1-hour) chart and differ from the general definition of the classic daily moving averages on the daily D1 chart.
Bollinger Bands
If EUR/USD moves up, the indicator's upper border at 1.0740 will serve as resistance. In case of a decline, the indicator's lower border at 1.0710 will act as support.
Description of indicators
- Moving average (moving average, determines the current trend by smoothing out volatility and noise). Period 50. It is marked yellow on the chart.
- Moving average (moving average, determines the current trend by smoothing out volatility and noise). Period 30. It is marked green on the chart.
- MACD indicator (Moving Average Convergence/Divergence - convergence/divergence of moving averages) Quick EMA period 12. Slow EMA period to 26. SMA period 9
- Bollinger Bands (Bollinger Bands). Period 20
- Non-commercial speculative traders, such as individual traders, hedge funds, and large institutions that use the futures market for speculative purposes and meet certain requirements.
- Long non-commercial positions represent the total long open position of non-commercial traders.
- Short non-commercial positions represent the total short open position of non-commercial traders.
- Total non-commercial net position is the difference between the short and long positions of non-commercial traders.