5M chart of GBP/USD
GBP/USD also fell on Friday, almost identical to EUR/USD. Even the trading signals were similar. There were no important events in Britain and in fact almost all the most important data has been already published this month. I think that the market has worked out all the bullish factors for the euro and the pound, so sterling should continue to fall for purely technical reasons. But it is quite enough for the trend to be preserved. On the one-hour chart, a descending trend line has been formed, so now traders have an excellent reference point.
Speaking of trading signals, the situation did not look great. At the beginning, the pair rebounded from 1.2007 and only managed to go 20 points up. It was enough to set the Stop Loss to Breakeven, and the long position was closed by this order. Then a sell signal was formed when the price settled below 1.2007, but it was rather ambiguous, since the price almost immediately turned out to be at the next level of 1.1974. As a result, traders could gain profit once the price settled below 1.1974, after which the pair went down about 20-30 points. That's how much they could earn by closing the deal manually closer to the evening.
COT report:
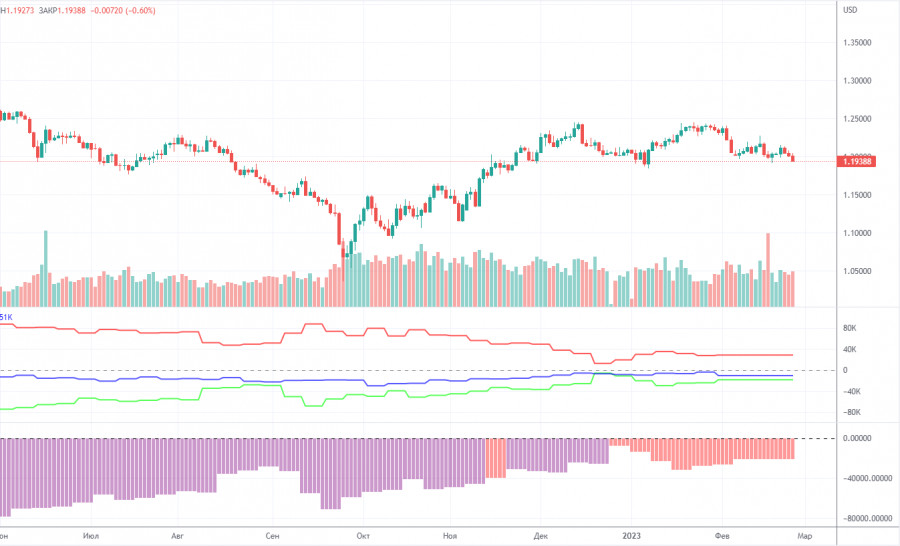
The COT report for the British pound has not been out for a month. The report for January 31 became available on Friday, which makes no sense since it came out a month ago. This report showed minimal changes. In the reporting week, non-commercial traders opened 1,400 long positions while the number of shorts decreased by 4,100. Thus, the net position of non-commercial traders increased by almost 10,000. The value of the net position has been steadily rising in recent months, but large market players are still bearish, and the GBP is rising against the USD (in the medium term), but from a fundamental perspective, it is very difficult to answer the question why it does it. The pound could start to fall in the near future. Formally, it has already started, but so far it looks like a flat. Take note that both major pairs are moving in a similar way, but the net position of the euro is positive and even implies an end of the upward movement, while it is negative for the pound... The non-commercial group of traders has a total of 54,000 long positions and 36,000 shorts. I am still rather skeptical about the long-term uptrend in the pound. The fundamental and geopolitical backgrounds do not favor a strong and swift rise in the British currency.
1H chart of GBP/USD
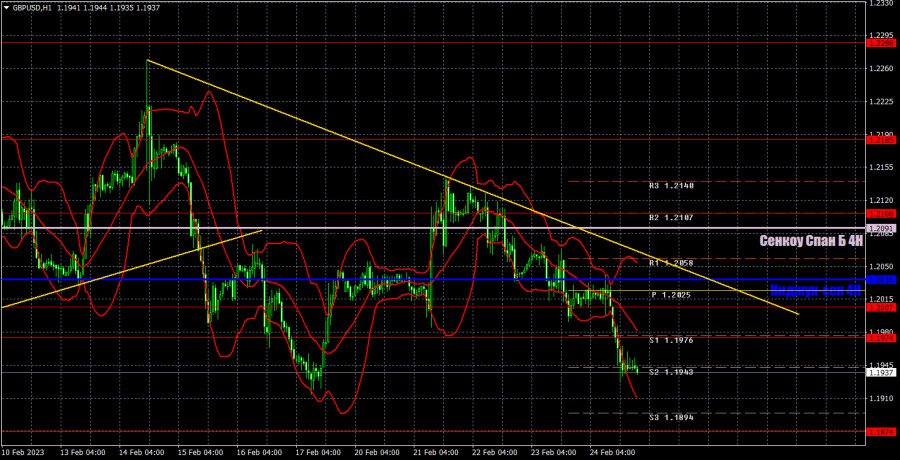
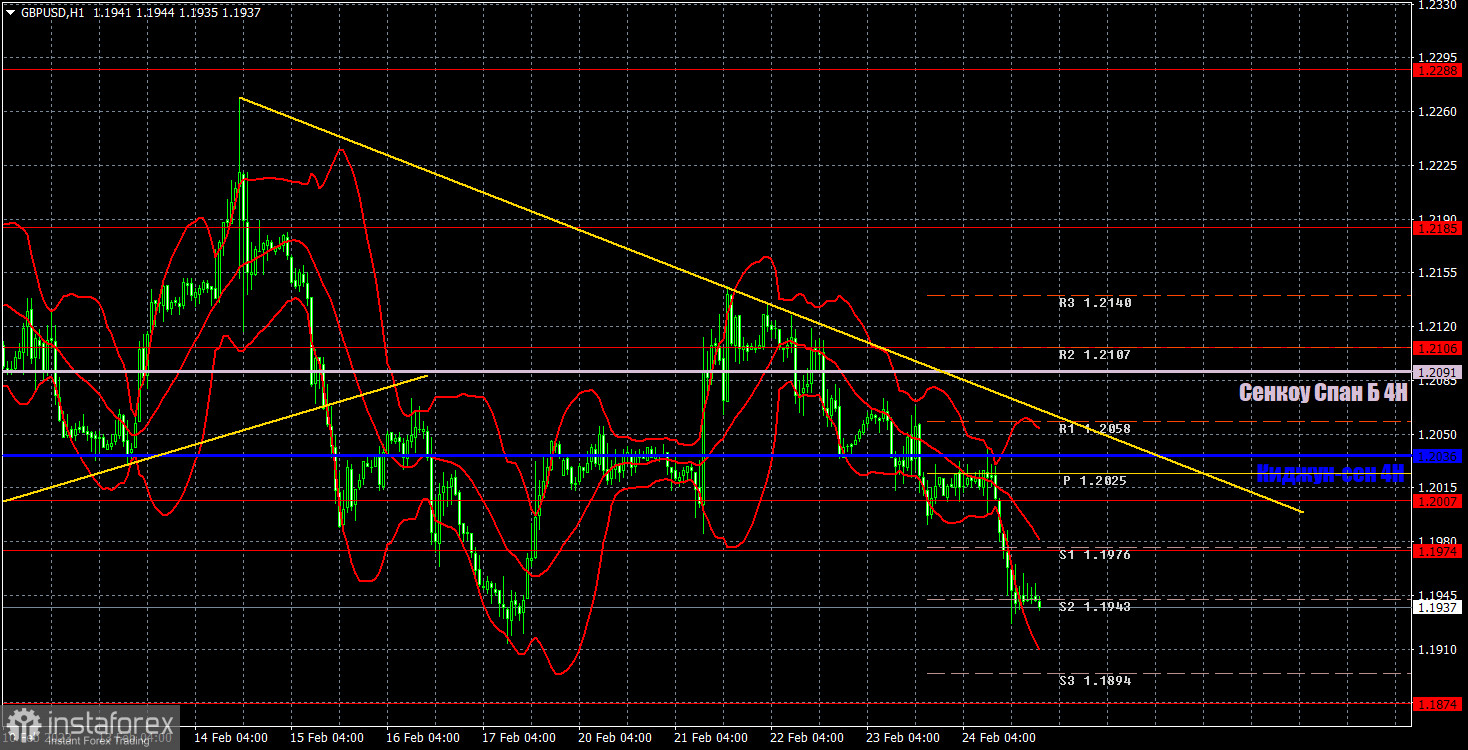
On the one-hour chart, GBP/USD resumed the downward movement, and is below all lines of the Ichimoku indicator and the trend line. Therefore, there is no reason (yet) to assume that the British currency will grow. At the same time the pair is approaching its last local low, from which a bounce may follow. On February 27, it is recommended to trade at the key level of 1.1760, 1.1874, 1.1974-1.2007, 1.2106, 1.2185, 1.2288. The Senkou Span B (1.2091) and Kijun Sen (1.2036) lines can also generate signals. Rebounds and breakouts from these lines can also serve as trading signals. It is better to set the Stop Loss at breakeven as soon as the price moves by 20 pips in the right direction. The lines of the Ichimoku indicator can change their position throughout the day which is worth keeping in mind when looking for trading signals. On the chart, you can also see support and resistance levels where you can take profit. On Monday, the UK macroeconomic calendar is empty, and there's only one report in the US, which can theoretically provoke market reaction. It is the Durable Goods Orders report.
Indicators on charts:
Resistance/support - thick red lines, near which the trend may stop. They do not make trading signals.
Kijun-sen and Senkou Span B are the Ichimoku indicator lines moved to the hourly timeframe from the 4-hour timeframe. They are also strong lines.
Extreme levels are thin red lines, from which the price used to bounce earlier. They can produce trading signals.
Yellow lines are trend lines, trend channels, and any other technical patterns.
Indicator 1 on the COT chart is the size of the net position of each trader category.
Indicator 2 on the COT chart is the size of the net position for the Non-commercial group of traders.