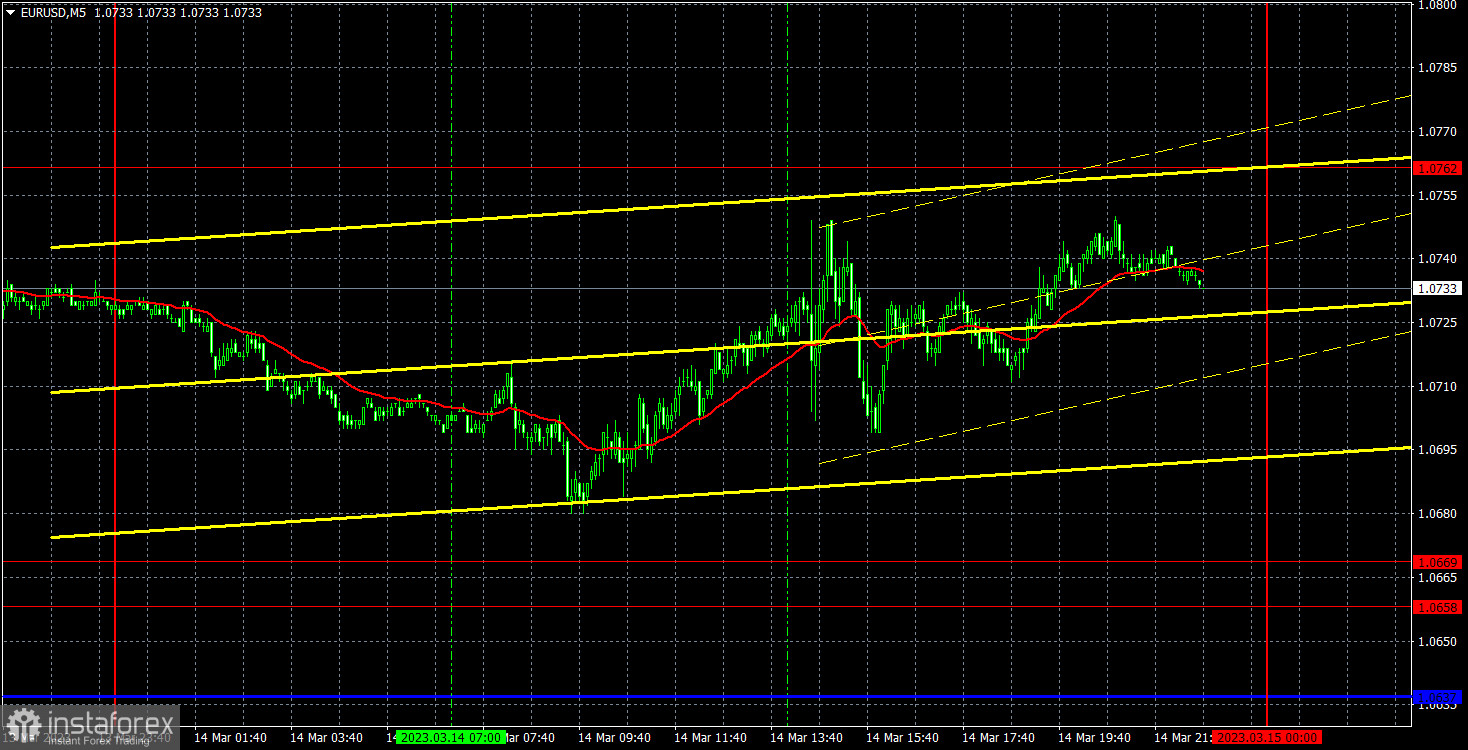
5M chart of EUR/USD
On Tuesday, EUR/USD traded mainly sideways. Despite the fact that there were quite important reports during the day, traders found no reason for volatile trading. Such behavior was partly justified, as US inflation was in line with forecasts, and therefore, failed to impress the traders. There were no more important reports, so there was only one burst of excitement during the day - at the beginning of the US trading session. But the overall volatility of the day was quite low. I still expect the euro to fall, but we have to admit that the chances for the dollar's growth decreased during the last week.
There is nothing much to say about Tuesday's trading signals. Not a single Ichimoku indicator line or level was reached. Perhaps, this is even better, because the movements weren't great, and it is better not to open positions at all than to open them using false signals.
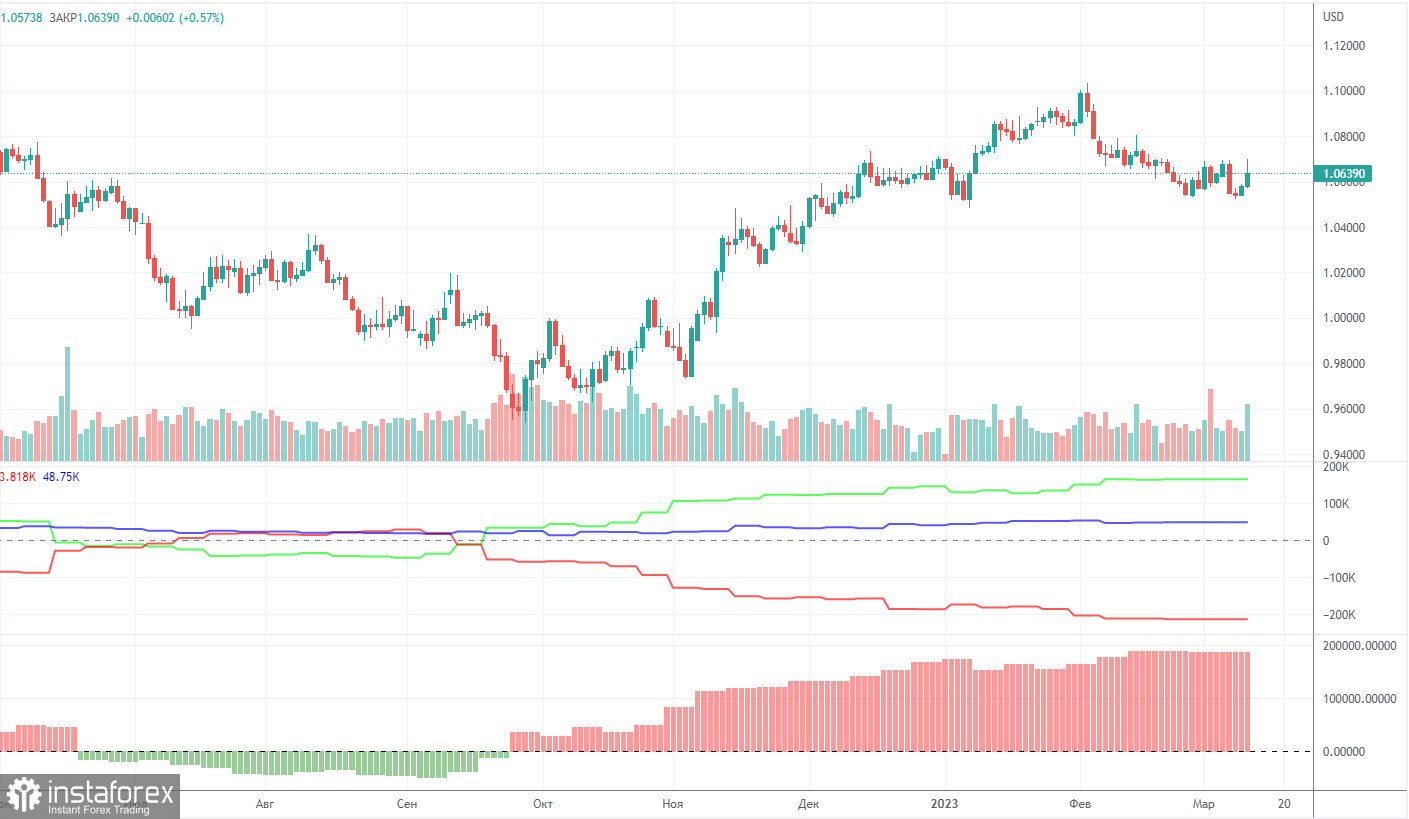
COT report:
A new COT report came out on Friday... for February 21... That was almost a month ago, while the report of February 14 has disappeared... It seems that the Commodity Futures Trading Commission will now publish reports with a month's delay for some time. In the event of this, the reports will hardly be of great importance. Recall that there was a technical glitch in the CFTC, so the data we receive now is considered irrelevant. So far, we can say that in the last few months, the overall picture has been corresponding to the market situation. On the chart above, we see that the net non-commercial position of large traders (second indicator) has risen since September 2022. At about the same time, the euro started to rise. The net non-commercial position is bullish and continues to increase with each new week, allowing us to expect the uptrend to stop shortly. Such a signal comes from the first indicator, with the green line and the red line being far apart, which is usually a sign of the end of a trend. The euro has already begun its bearish move against the greenback. So far, it remains unclear whether it is just a bearish correction or a new downtrend? According to the latest report, non-commercial traders closed 100 long positions, and 1,300 short ones. Consequently, the net position rose by 1,200. The number of long positions exceeds that of short ones by 165,000. In any case, a correction has been looming for a long time. Therefore, even without reports, it is clear that the downtrend will continue.
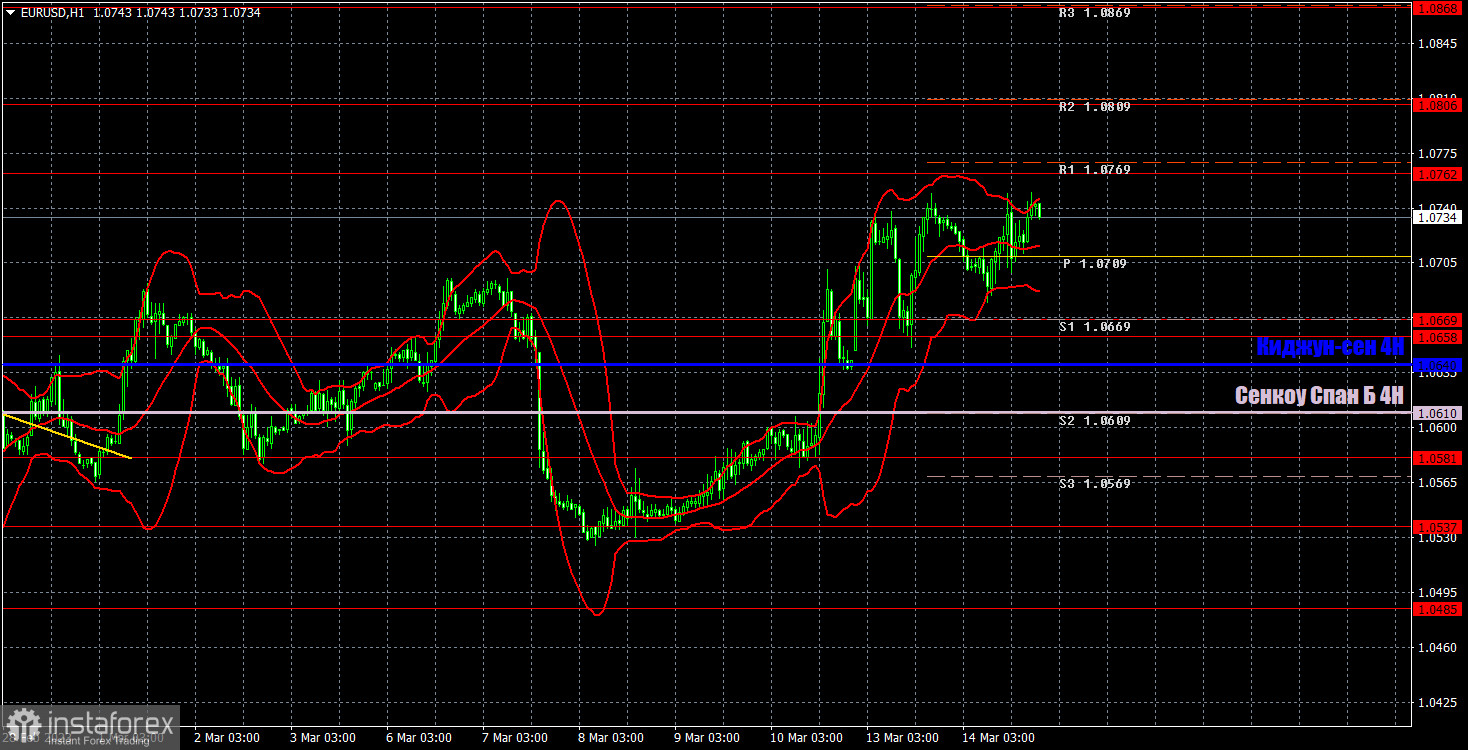
1H chart of EUR/USD
On the one-hour chart, EUR/USD surged, but in general, the entire movement still appears more like a "swing" than a trend. I am quite sure that the pair might start to sharply fall this week, since it doesn't have such strong reasons to grow. Of course the outcome of Thursday's European Central Bank meeting can support the EUR as well as ECB President Christine Lagarde's speech but anyway the single currency has already gained quite a bit and it is difficult to expect the central bank to toughen its hawkish rhetoric now.
On Wednesday, important levels are seen at 1.0537, 1.0581, 1.0658-1.0669, 1.0762, 1.0806, 1.0868, 1.0938, and also Senkou Span B (1.0610) and Kijun Sen (1.0640). Ichimoku indicator lines can move intraday, which should be taken into account when determining trading signals. There are also support and resistance although no signals are made near these levels. They could be made when the price either breaks or rebounds from these extreme levels. Do not forget to place Stop Loss at the breakeven point when the price goes by 15 pips in the right direction. In case of a false breakout, it could save you from possible losses. On March 15, the EU will publish an absolutely insignificant industrial production report for January, while in the US, the producer price index and retail sales aren't that important either. The market might react to these reports, but it is unlikely to have much effect on market sentiment.
Indicators on charts:
Resistance/support - thick red lines, near which the trend may stop. They do not make trading signals.
Kijun-sen and Senkou Span B are the Ichimoku indicator lines moved to the hourly timeframe from the 4-hour timeframe. They are also strong lines.
Extreme levels are thin red lines, from which the price used to bounce earlier. They can produce trading signals.
Yellow lines are trend lines, trend channels, and any other technical patterns.
Indicator 1 on the COT chart is the size of the net position of each trader category.
Indicator 2 on the COT chart is the size of the net position for the Non-commercial group of traders.