Yesterday there were no signals to enter the market. Let us take a look at the 5-minute chart to figure out what happened. Earlier, I asked you to pay attention to the level of 1.0727 to decide when to enter the market. It was a couple of points before the test of the mentioned area, so it was not possible to get a buy signal from there. In the second part of the day, the euro sharply fell by more than 200 pips due to the European banking sector's problems, so we didn't get any good signals to enter the market.
Conditions for opening long positions on EUR/USD:
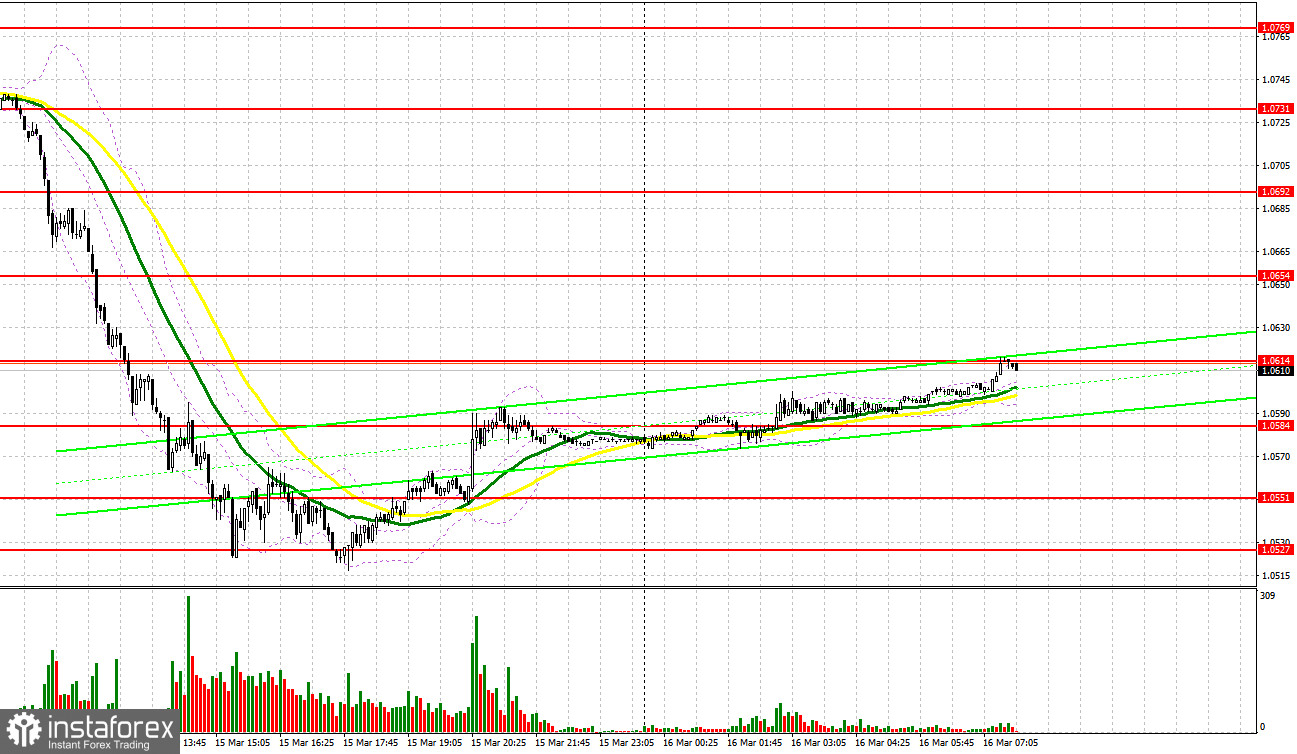
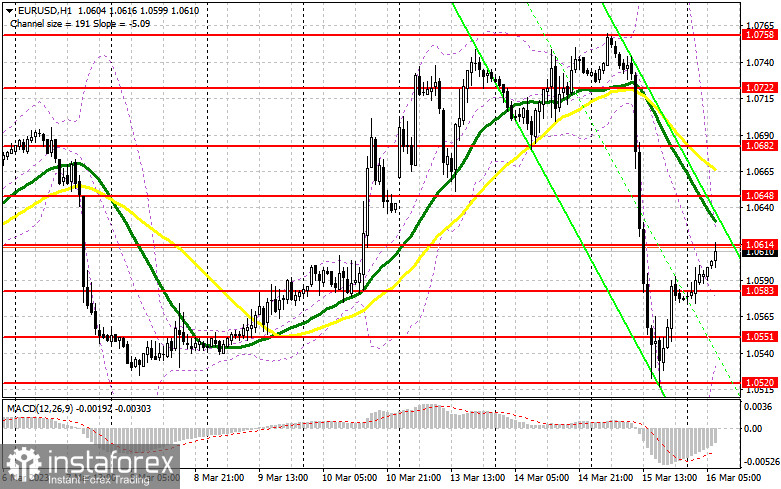
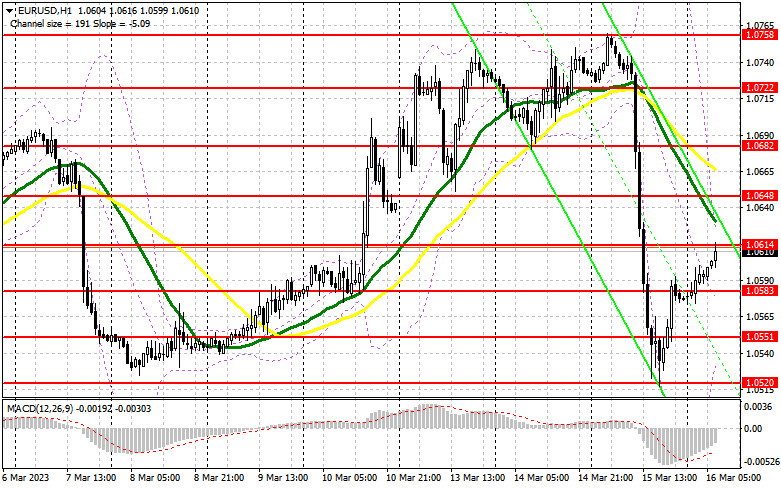
The Swiss regulator's intervention in Credit Suisse's operations and credit line led to a sharp collapse of the euro. Now investors are no longer confident that the European Central Bank will be able to deliver on all of its promises of lower inflation this year. An aggressive interest rate hike by the ECB poses a huge question mark, as it could lead to a collapse in banking and more serious problems than the current inflation rate. In the afternoon, we'll find out what ECB President Christine Lagarde plans to do in this situation. In the meantime, in case the euro is under pressure again amid the lack of important fundamental data in the eurozone, we should focus on the nearest support level of 1.0583. A false breakout through the barrier will create a buy entry point with the target at 1.0614, which is in line with the bullish moving averages. An additional buy entry point will form if the price breaks and tests this mark to the downside, and the price may head towards 1.0648, where the bulls will have a tough time. A breakout through 1.0648 will trigger a row of bearish stop orders and make an additional signal with the target at 1.0682, where I am going to lock in profits. However, this scenario will only be possible if the ECB maintains its hawkish stance. If EUR/USD goes down and there is no bullish activity at 1.0583, which is also possible, because the euro might be under pressure at any moment, a breakout through the level will cause a fall to the support level of 1.0551. Only a false breakout through it will generate a buy signal. The trading plan will also be to buy from the 1.0520 low, or even lower at 1.0487, allowing a bullish correction of 30 to 35 pips intraday.
Conditions for opening short positions on EUR/USD:
Yesterday, the bears successfully returned the euro to the lows of the month, but then speculators took advantage of the momentum and placed longs on the low. Now the bears should focus on protecting the nearest resistance at 1.0614, which could be tested in the European session. The trading plan will be to sell after a false breakout there, targeting the nearest support level of 1.0583. A breakout and a reverse test of this range, while we don't have any important reports to assess, may trigger a decline with an additional signal to sell at 1.0551. Consolidation below that level after the ECB announces its decision on interest rates will lead to a steep fall to 1.0520, where I am going to lock in profits. In case of growth in EUR/USD in the European session and the absence of the bears at 1.0614, which is also a realistic scenario, I would recommend putting off short positions to 1.0648, where the moving averages are also passing. There you can sell after a false breakout. On a rebound, EUR/USD could be sold at the 1.0682 high, allowing a bearish correction of 30 to 35 pips intraday.
COT report:
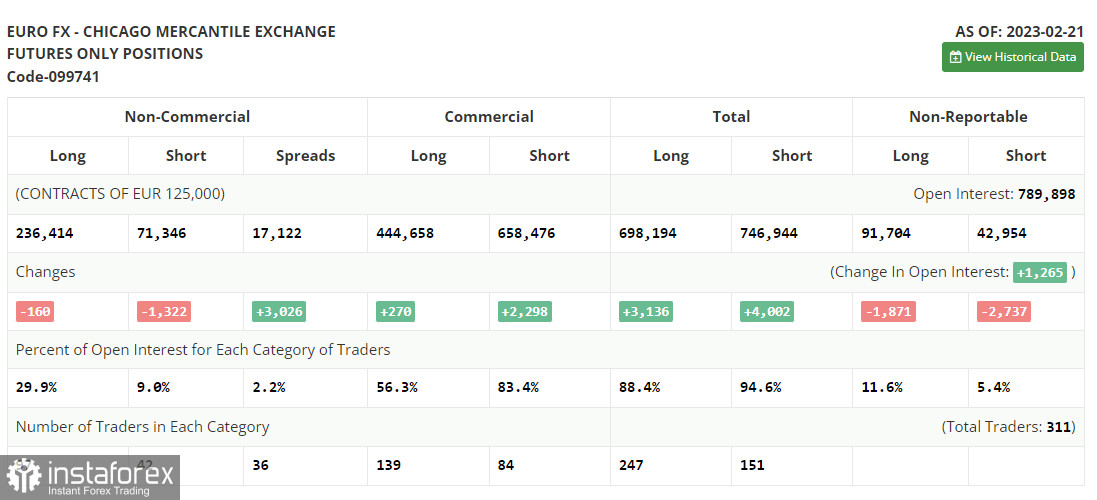
The COT report for February 21 logged a decrease in both long and short positions. In fact, the COT data from a month ago is of little interest at this point as it is not relevant due to the technical glitch the CFTC recently suffered. Waiting for fresh reports is all that's left. One of the main events of the week will be US inflation, which may persuade traders that the Fed will unlikely continue its aggressive stance on monetary policy. The SVB meltdown and risks of a collapse in the US banking sector will surely change the Fed's stance on rate hikes. According to the COT report, long non-commercial positions decreased by 160 to 236,414. Short non-commercial positions dropped by 1,322 to 71,346. The non-commercial net position came in at 165,038 versus 150,509. The weekly closing price fell to 1.0698 from 1.0742.
Signals of indicators:
Moving Averages
Trading is performed below the 30- and 50-day moving averages, indicating a bearish bias.
Note: The author considers the period and prices of moving averages on the one-hour chart which differs from the general definition of the classic daily moving averages on the daily chart.
Bollinger Bands
In case of a decline, the lower limit of the indicator located around 1.0530 will act as support.
Description of indicators
- Moving average (a moving average determines the current trend by smoothing volatility and noise). The period is 50. It is marked in yellow on the chart.
- Moving average (a moving average determines the current trend by smoothing volatility and noise). The period is 30. It is marked in green on the graph.
- MACD indicator (Moving Average Convergence/Divergence - convergence/divergence of moving averages). A fast EMA period is 12. A slow EMA period is 26. The SMA period is 9.
- Bollinger Bands. The period is 20.
- Non-profit speculative traders are individual traders, hedge funds, and large institutions that use the futures market for speculative purposes and meet certain requirements.
- Long non-commercial positions are the total number of long positions opened by non-commercial traders.
- Short non-commercial positions are the total number of short positions opened by non-commercial traders.
- The total non-commercial net position is a difference in the number of short and long positions opened by non-commercial traders.