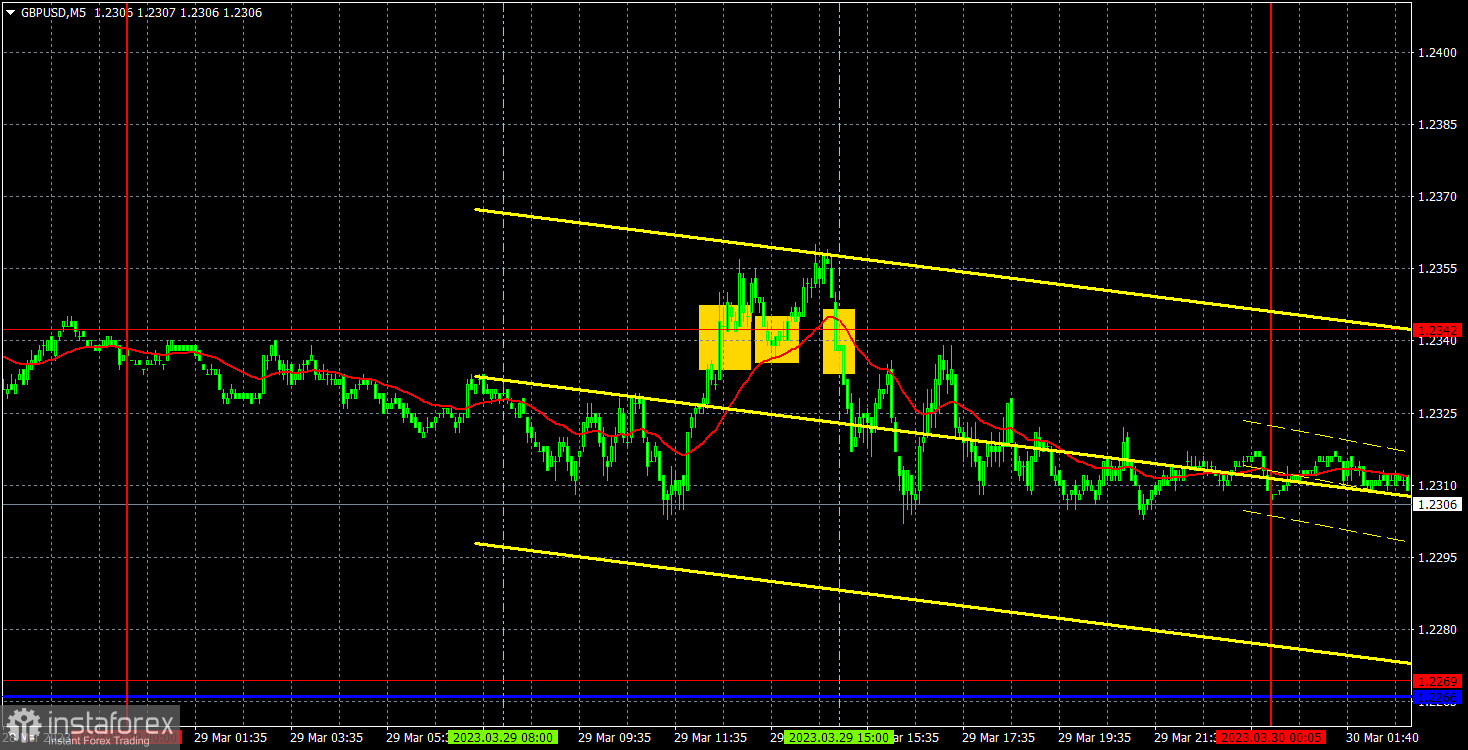
5M chart of GBP/USD
On Wednesday, GBP/USD tried to break through 1.2342, but failed. Since this is already the second attempt to overcome this level, the "double top" pattern could be formed, so there's grounds for the pound to fall. Not to mention the last round of growth by 500 points looks rather strange if it were not for the flat on the 24-hour chart. So far, all we have is the rebound from 1.2342 and the fact that GBP broke through the uptrend line. But it's been several days and the bears are still not active. The price is above the Ichimoku indicator lines, so we need to at least overcome them first. Fundamental and macroeconomic fundamentals were lacking on Wednesday. Volatility was not high. All this complicates the process of trading.
Yesterday, there were three trading signals and they were all false. All three were near 1.2342, which the pair crossed twice, each time for 10-15 minutes. As a result, at first, the pair settled above that level and managed to go up 5 points, then the pair settled below that level and managed to go down about 20 points. In the first case, there was a loss, and in the second, a Stop Loss to break even. It wasn't the best trading day, but the movements were not attractive either.
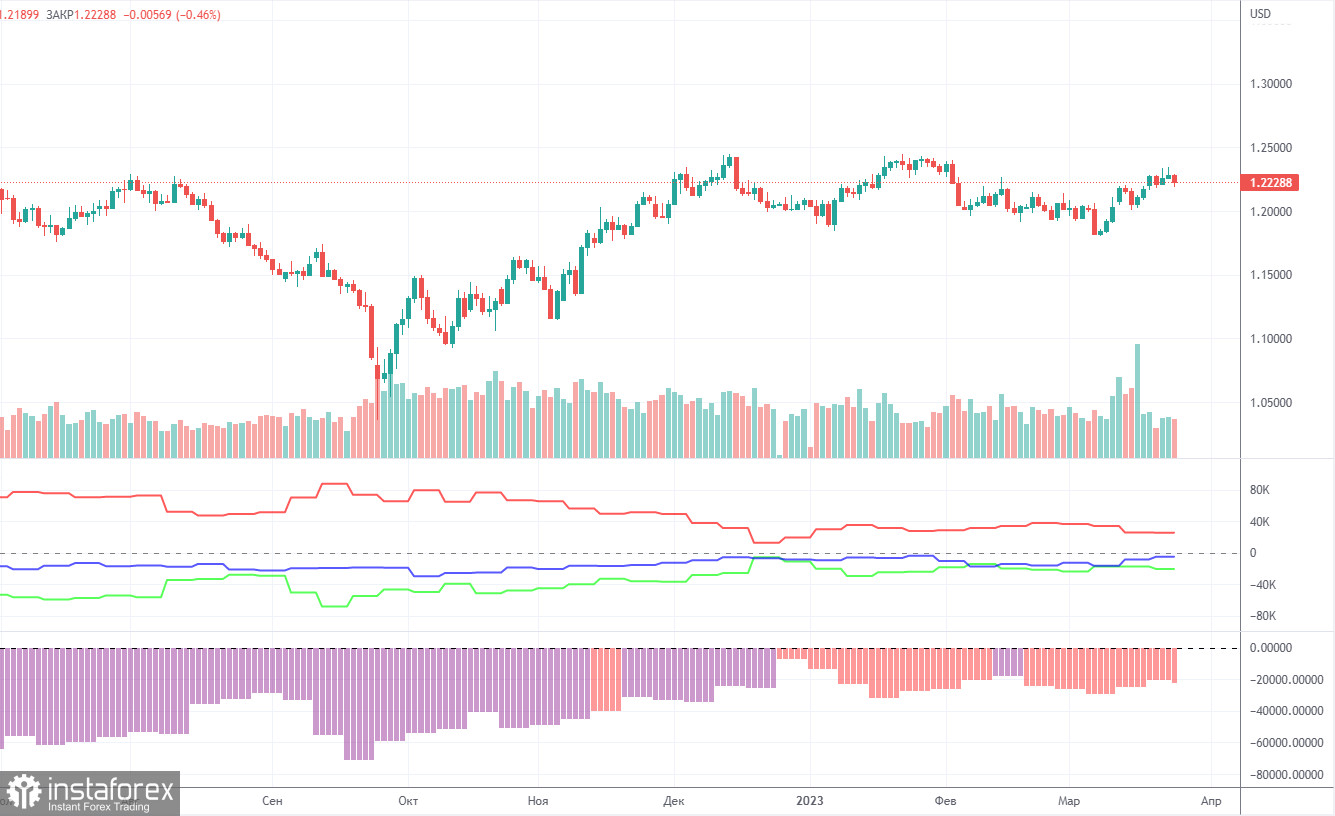
COT report:
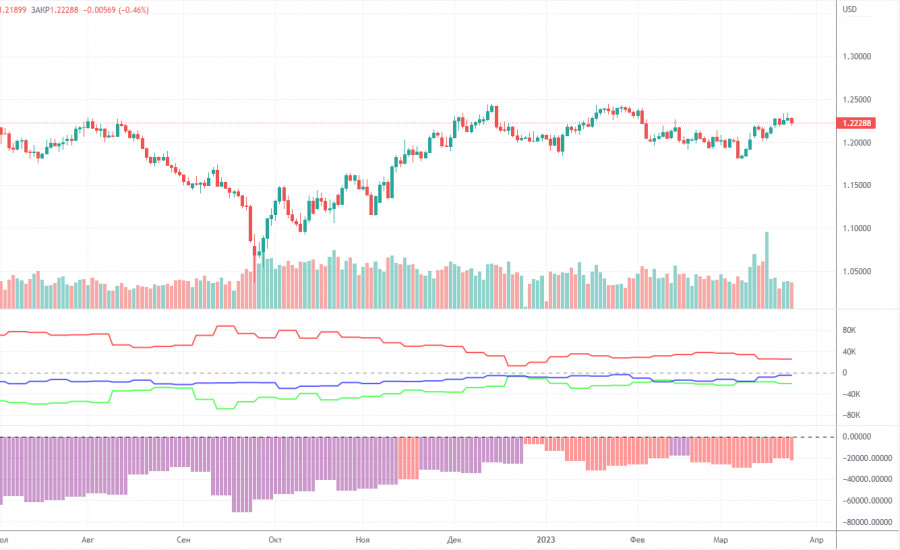
For the British pound, the Commodity Futures Trading Commission has caught up with the lost time and has now released reports exactly on time. The last report available is for March 21. According to that report, the non-commercial group closed 3,700 long positions and 500 short ones. Thus, the net position of non-commercial traders decreased by 3,200 but continues to grow. The net position indicator has been steadily growing over the past months but the mood of major traders still remains bearish. Although the pound sterling is growing against the dollar (in the medium term), it is very difficult to answer the question why it is doing this from a fundamental point of view. It is quite possible that the pound sterling may slump in the near future. Formally, it has already begun its downward movement but so far it looks more like a flat. Notably, both major pairs are moving similarly at the moment. However, the net position for the euro is positive and even implies the imminent completion of the upward momentum, whereas for the pound it is negative, which gives rise to expectations of further growth. But at the same time, the pound has already grown by 2100 points, which is a lot, and without a strong bearish correction the continuation of the growth will be absolutely illogical. The non-commercial group opened a total of 49,000 shorts and 28,000 longs. We remain skeptical about the long-term growth in the British currency and expect it to fall deeper.
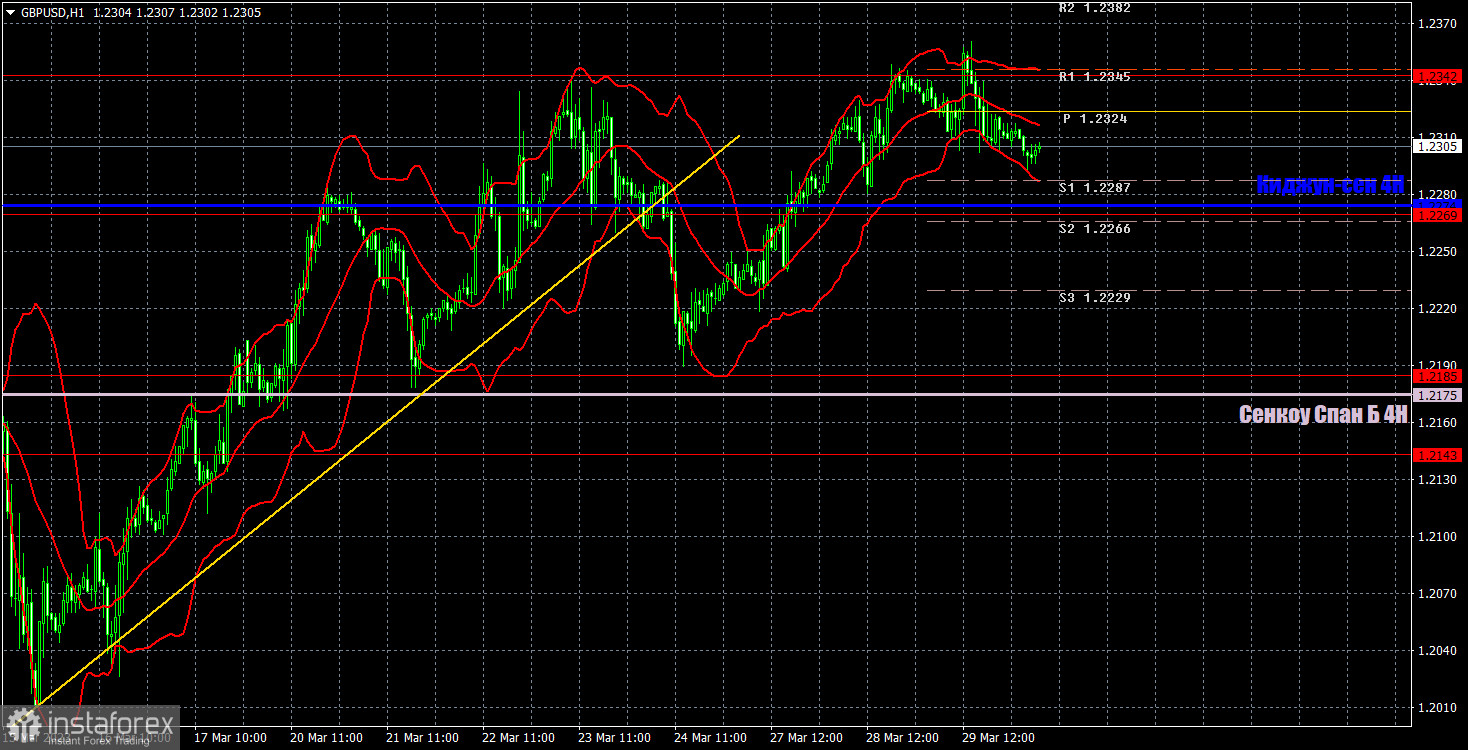
1H chart of GBP/USD
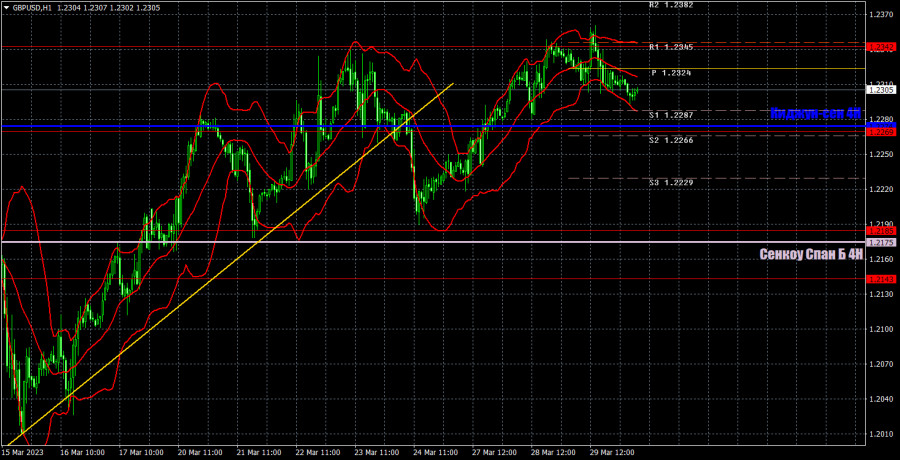
On the one-hour chart, GBP/USD has overcome the trend line, but it has already consolidated above the critical line and it seems that it is ready to revive the uptrend. GBP has not overcome 1.2342, which gives hope for the "double top" and the pound's decline, but the price still hasn't settled below the critical line. It is too early to draw conclusions. Volatility is low, there are almost no reports and events. On March 30, it is recommended to trade at the key level of 1.1927, 1.1965, 1.2143, 1.2185, 1.2269, 1.2342, 1.2429-1.2458, 1.2589. The Senkou Span B (1.2175) and Kijun Sen (1.2274) lines can also generate signals. Rebounds and breakouts from these lines can also serve as trading signals. It is better to set the Stop Loss at breakeven as soon as the price moves by 20 pips in the right direction. The lines of the Ichimoku indicator can change their position throughout the day which is worth keeping in mind when looking for trading signals. There are no important events planned for Thursday in Britain. In the United States, only the GDP report for the fourth quarter in the third estimate, which is not too important. Thus, volatility is unlikely to increase today and the nature of the pair's movement will change.
Indicators on charts:
Resistance/support - thick red lines, near which the trend may stop. They do not make trading signals.
Kijun-sen and Senkou Span B are the Ichimoku indicator lines moved to the hourly timeframe from the 4-hour timeframe. They are also strong lines.
Extreme levels are thin red lines, from which the price used to bounce earlier. They can produce trading signals.
Yellow lines are trend lines, trend channels, and any other technical patterns.
Indicator 1 on the COT chart is the size of the net position of each trader category.
Indicator 2 on the COT chart is the size of the net position for the Non-commercial group of traders.