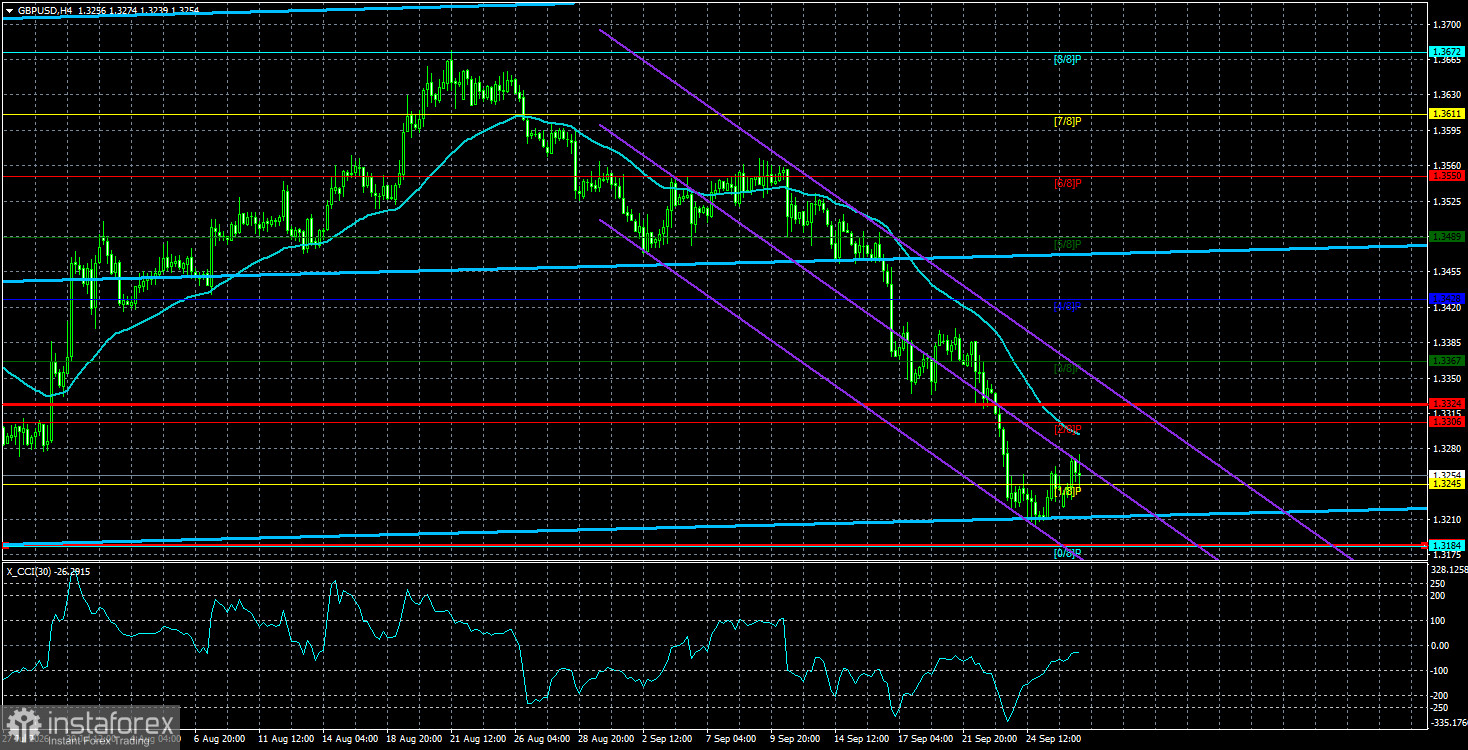
The GBP/USD pair also traded fairly calmly on Monday, as we expected given an absolutely empty economic calendar. In the EUR/USD article, we already noted that a range persists in the long term. For GBP/USD, that range is even more obvious if you open the weekly timeframe. The pair has traded for a year between 1.3150 and 1.3780. What is that if not a range? Most traders are used to trading small timeframes and are therefore not accustomed to year-long sideways moves. But those happen too.
Therefore, we can explain the current decline in the pound not by a "hawkish" Federal Reserve stance or some other fantasy. We can explain it painfully — the range continues. The weekly-timeframe range is part of the uptrend that began back in 2022. Accordingly, after the sideways movement ends, we expect the pound's rally to resume. Recall that earlier this year both the euro and the pound set new four-year highs, and many experts loudly predicted the dollar would fall further. Yes, then the war in the Middle East began, which certainly changed things. Yes, US inflation then accelerated to 4.2%, forcing the Fed into a tougher stance, according to Trump. However, the first factor no longer benefits the dollar much, because the Middle East conflict is no longer new and investors who wanted to shelter their capital have already done so. As for the second factor, how much longer can the dollar keep rising on that basis?
The Bank of England is also leaning hawkish ahead of upcoming meetings. Inflation in the United Kingdom is rising too, so the BoE has little choice but to raise rates as well. The UK's tightening will start a little later. The European Central Bank began raising its key rate first, but the market did not interpret that as "first mover wins"! Thus the BoE may deliver as many tightenings over the next few meetings as the Fed.
Also note that, on the daily timeframe, the pound has, for the third time, fallen to the 38.2% Fibonacci level at 1.3191. The Fibonacci grid is drawn from December 2024 to December 2026. One can assume that around 1.3191 lies the lower boundary of another sideways channel. Therefore, a rebound from this level, or liquidity removal at the previous two lows, could provide the basis for a strong price reversal to the north, and then, in a few weeks, experts will be scrambling to explain the pound's rise. Another sideways channel is 1.3150–1.3650. We do not believe the macroeconomic backdrop will play a key role for the market this week. Important reports are scheduled, but the market is currently moving by other principles.
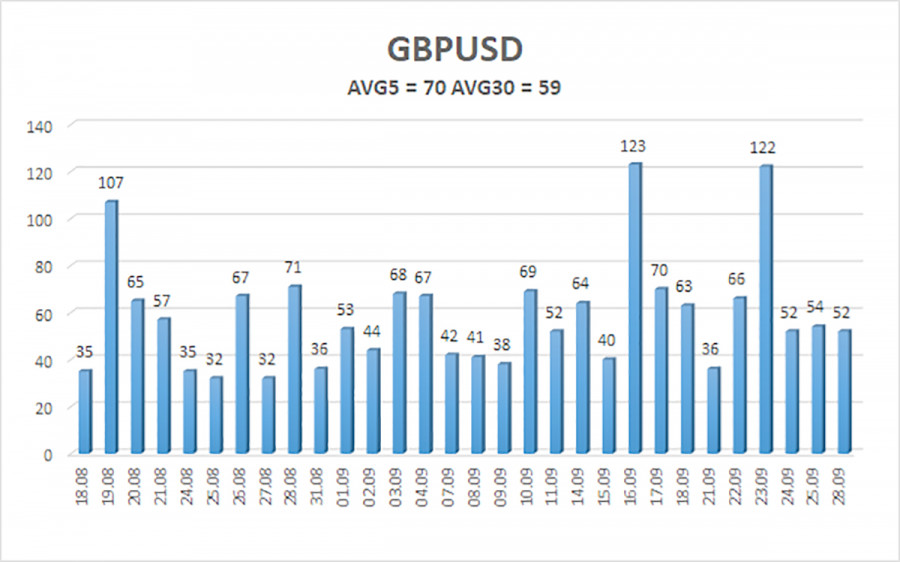
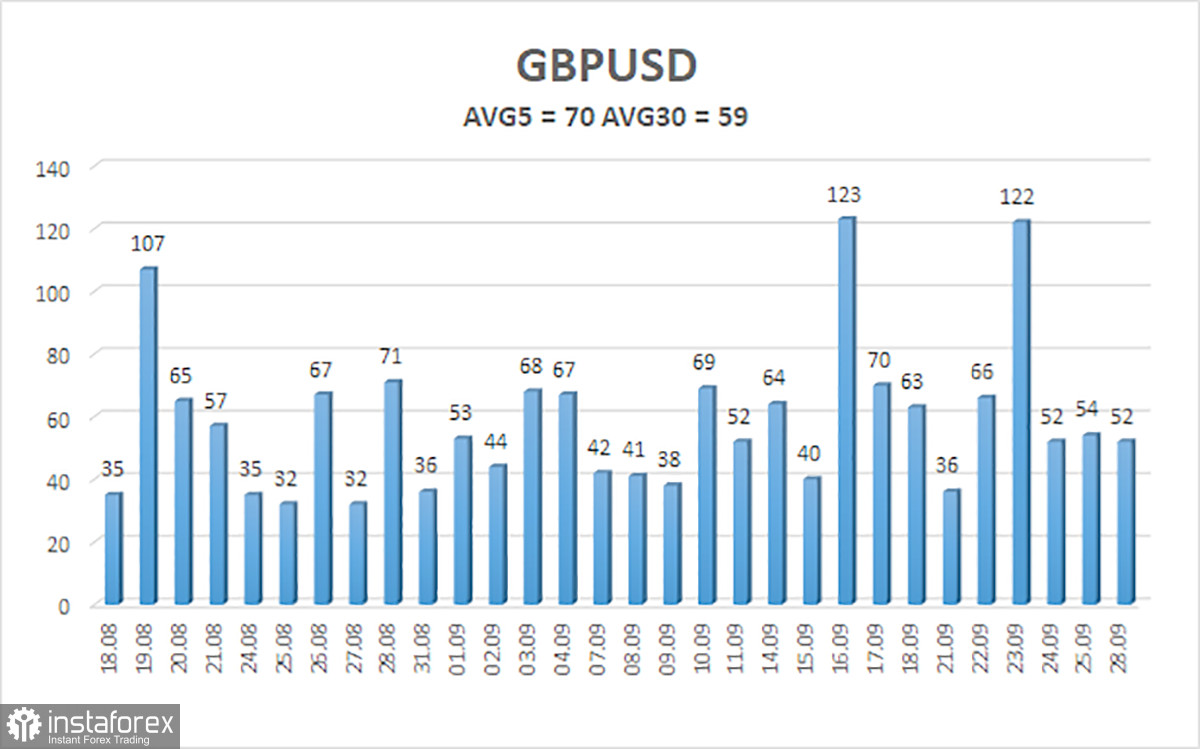
The average volatility of the GBP/USD pair over the last 5 trading days is 70 pips. For the pound/dollar pair, this value is characterized as "average." On Tuesday, September 29, therefore, we expect movement within the range bounded by 1.3184 and 1.3324. The higher linear-regression channel is pointing upward, indicating an uptrend. The CCI indicator has entered the oversold area twice, warning of a possible end to the downward trend.
Nearest support levels:
S1 – 1.3245
S2 – 1.3184
S3 – 1.3123
Nearest resistance levels:
R1 – 1.3306
R2 – 1.3367
R3 – 1.3428
Trading Recommendations:
The GBP/USD pair continues its illogical downward movement. Donald Trump's policies will continue to pressure the US economy, so we do not expect long-term gains from the US dollar. 2026 has been positive for the dollar so far due to geopolitics and inflation, which forced capital to seek refuge and prompted the Fed to return to tightening monetary policy. However, on the weekly timeframe, a flat range between 1.3150 and 1.3780 persists within a four-year uptrend, which allows expecting pound appreciation in the medium term. Consider long positions with targets of 1.3367 and 1.3428 when price is above the moving average. Price below the moving average allows bearish trading, with targets of 1.3184 and 1.3123.
Explanations for Illustrations:
Regression channels help determine the current trend. If both are directed in the same direction, it means the trend is currently strong;
The moving average line (settings 20,0, smoothed) defines the short-term trend and the direction in which trading should be conducted at present;
Murray levels are target levels for moves and corrections;
Volatility levels (red lines) are the probable price channel within which the pair will spend the next 24 hours based on current volatility indicators;
The CCI indicator – its entry into the oversold area (below -250) or the overbought area (above +250) indicates that a trend reversal in the opposite direction is approaching.