A straight line, connecting two neighboring lows, shows the minimal strength denominator of bulls; and the line, connecting two neighbouring tops, shows the lowest strength denominator of bears. These lines are called trend lines. Trend lines are applied for the trend detection.
During the support period the upward trend line is drawn through the lowest points of the diagram; during the resistance period the line of downward trend is drawn through the tops. The continuation of these trends helps forecast the buying/selling prices for future periods.
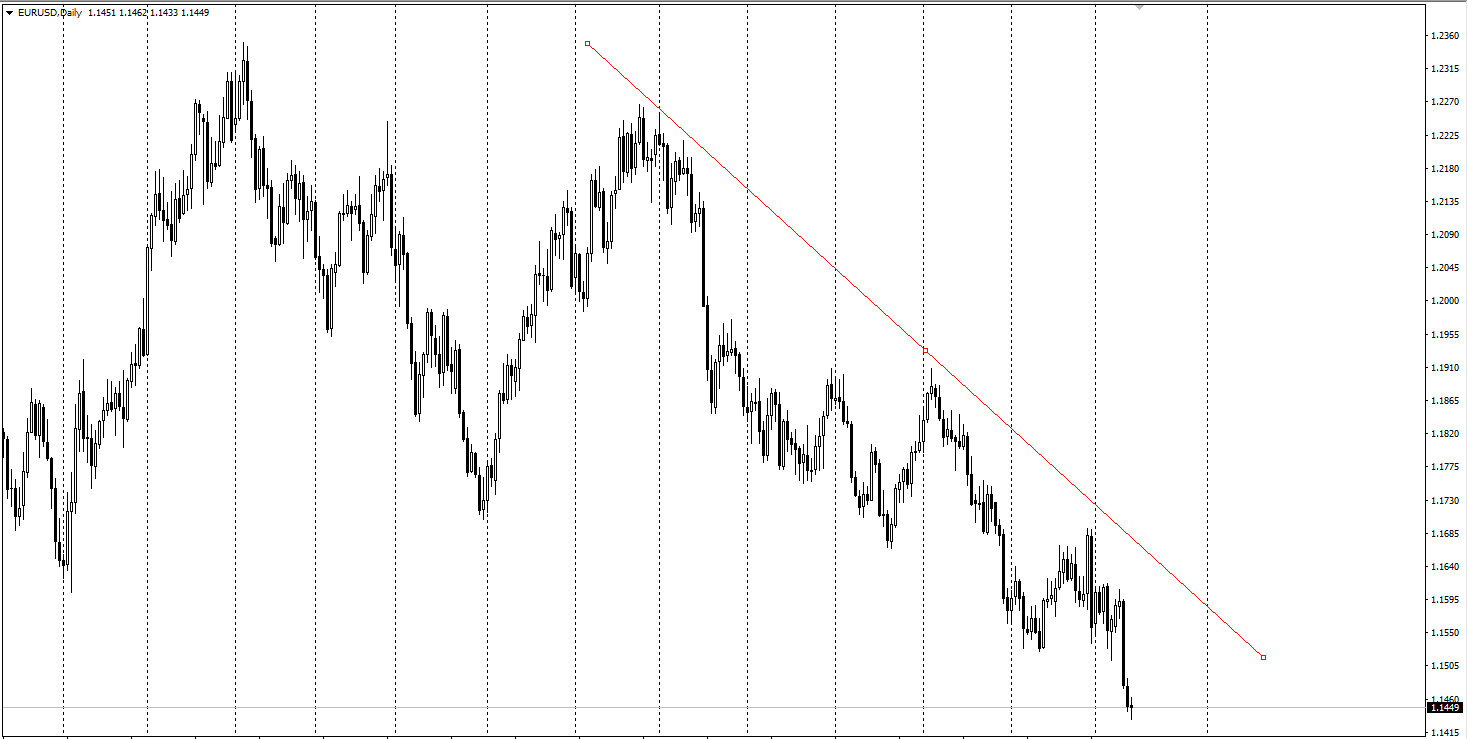
Image 1. Trend line
The most important characteristic of a trend line is the value of its angle. It shows the dominant force of the market.
Trend lines are the oldest tools of the technical analysts. At present time the computational methods, such as moving average and linear regression, combined vertical and horizontal filter, Zigzag, directional system, and MACD are used for the trends determination.
How to draw a trend line?
Most of the analysts build the trend lines through the extreme highs and lows, but it is better to draw them through the extreme points of the prescribed area. The thing is that spikes are connected with the short-term panic mood of the crowd and short-term speculations.
Victor Sperandeo in his book 'Trader Vic' offered another method of trend line construction. He suggests to draw a line of the upward trend from the lowest price of the period to the point of the lowest prices of the largest level which precedes the highest point of the period. The interval of the trend line between these two points may not have the crossing with the chart. The intersection with the trend line is the first sign that trend changes. The second is when the price did not overcome the previous upper price level. The third sign is that the price came below the previous lower level. This is a sign of the trend reversal.
Estimation of trend lines
The most important characteristic of a trend line is the value of its slope. The estimation of trend lines is made on following five factors: temporary base of trend line diagram, length, number of points touching the price chart, angle of slope and sales volumes.
With the increase of the temporary base of the diagram, the importance of trend line grows.
The longer the trend line is, the safer it is.
The bigger number of touching with the chart the trend line has, the safer it is.
The angle between the trend line and horizontal axis shows the intensity of emotions in the dominant mood of traders.
If the sales volumes advance with the price movement in the direction of trend line and decrease during corrections, this works as its confirmation. If the volumes increase with the trend line, there can be a reversal at the market, the falling of the sales volumes according to the movement of price chart from the trend line is also an alerting signal.
Reversals of trend line
Reversal at trend line can happen only in case if closing prices are on the other side of the trend line. Some analysts consider trend line as “broken” if the depth of penetration is no less than 2-3% points of the price (for example, $8-12 with $400 per troy ounce).
Rules for traders
1. Open positions which correspond with the direction of the trend line’s slope. If it is upwardly directed, look for the possibility to open a buy position, avoiding short positions. If it is downwardly directed, open short positions, avoiding purchases.
2. Trend lines set the [[Support and resistance levels|support and resistance levels]]. With the price growth during the upward trend, buy position should be opened, with the decrease below the trend line to set the stop loss.
3. The slope of the trend line anticipates the sharp reversals. If the slope of the line is more than 450, then put the order for position closing on the right side of trend line, and re-check every day the fulfillment of conditions.
4. After the reversal of the steep trend line, prices are often back to their last extreme value. With the correctional support till the previous price level, the fall in sales volume and the divergence of the indicator determine the appropriate moment for the opening of a short position. The price reduction to the previous low level after reversal of the downward trend line is the appropriate moment for the opening of the low risky position for the purchase.
5. The channel line should be parallel with the trend line and used for determination of the probable profit.
Channel line
The channel consists of two parallel lines between which there is a price chart. If the line of the upward trend goes through the lowest prices during reactions, the channel line is built through the upper prices of supports.
As well as the trend lines, the channel lines should be built through the extreme points of the temporary interval, not taking into account the intermediate extremes. The existence of the channel line strengthens the value of the corresponding trend line. The value of the channel line directly depends on its number of points which touch the price chart.
The wider the channel is, the stronger the trend is. Long position should be opened at the level which corresponds to the lowest quarter or half of the channel’s width with price increase; the short position is opened at the upper quarter or half of the channel’s width with price decline. The positions are closed at the opposite side of the channel.
Preliminary trend line
The trend line is usually drawn through two points at least. However, there is little-known technique of trend line’s construction, going through one point.
During the support period after the reversal of downward trend line, it can be assumed that downward trend ended and the upward started. Having drawn the line through the points of the last two tops, we have the channel line of a new trend. Having drawn the parallel line to it through the point which corresponds with the last low price, we get the line of a new trend. This line shows where we should wait for the next minimum of the price. The lines, which were built with the help of this technique and drawn through the lowest points, as a rule, work better than the lines, which were drawn through the highest points.
Line of the trend and scale
Why is the trend represented as a straight line? The linear models are simple; they are very easy to interpret and, moreover, can reflect the major tendencies, even if the process is nonlinear. On the other hand, the visible nonlinearity in the price diagram may turn out to be only as the result of “noise” or accidental fluctuations.
If there is a clear nonlinearity in the price chart, which sometimes is observed at the long periods of time or in the periods of strong price increase on the assets, the building of the line is complicated. Such changes of prices are usually described by the exponential dependence. In this case with the building of the price diagram it is better to use the logarithmic scale. The highs and lows at such diagrams are “placed” along the straight lines, and the technique of trend analysis described above can be used.
More about trend lines
The price level, which is below the point of the trend line’s reversal and is over the distance, which is equal to the distance measured vertically from the trend line to the last highest point, works for the assessment of the price change.
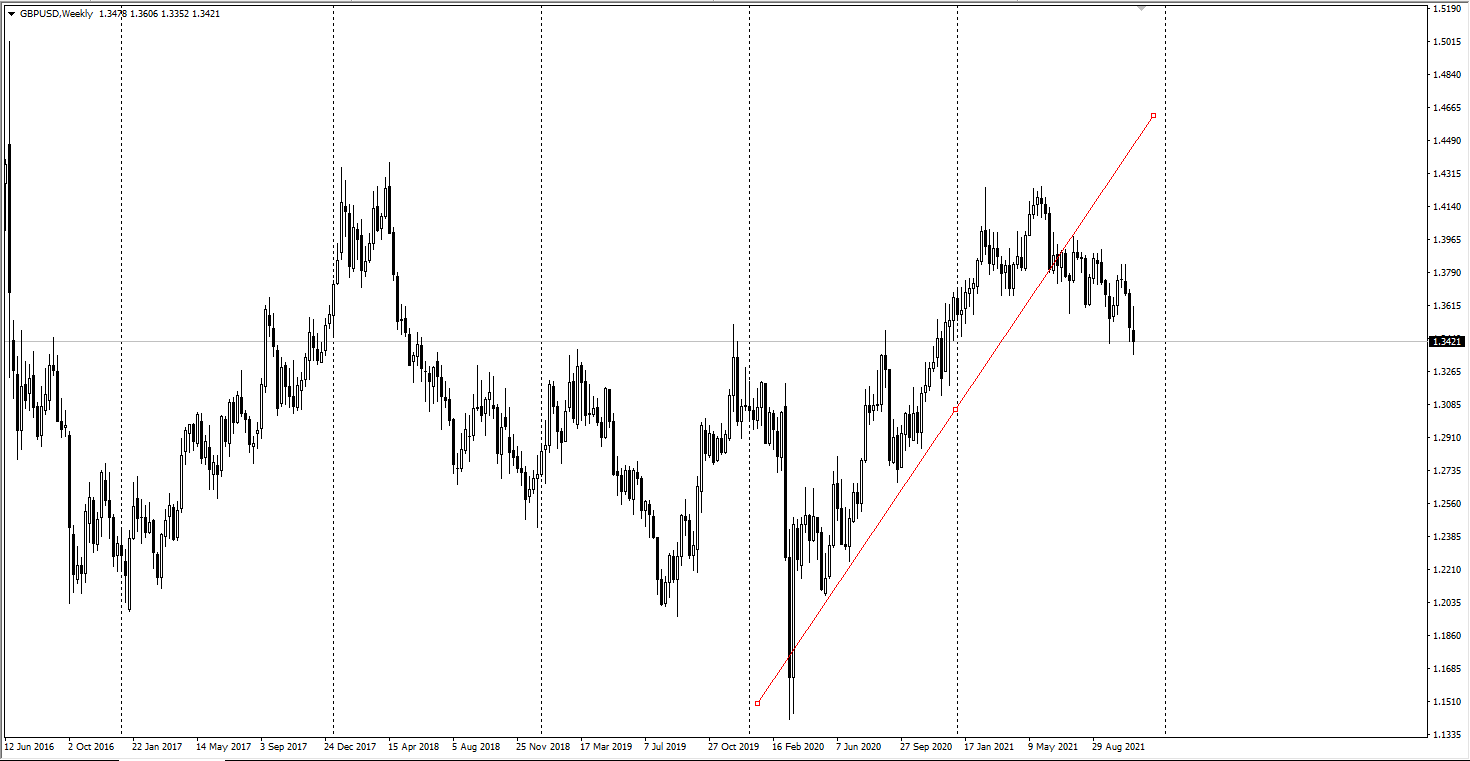
Image 2. Trendline breakdown.
Trend lines can be also built for the diagrams of purchase volume and for the indicators of the market. The line of the upward trend of the purchase volumes confirms the current trend of prices; the downward trend means the refuse of market participants to follow the current trend. Among the technical indicators the Relative Strength Index (RSI) gives a great correspondence with the analysis of trend lines. The reversal of its lines often happens before the trend line’s reversal.
During the support period the upward trend line is drawn through the lowest points of the diagram; during the resistance period the line of downward trend is drawn through the tops. The continuation of these trends helps forecast the buying/selling prices for future periods.
Image 1. Trend line
The most important characteristic of a trend line is the value of its angle. It shows the dominant force of the market.
Trend lines are the oldest tools of the technical analysts. At present time the computational methods, such as moving average and linear regression, combined vertical and horizontal filter, Zigzag, directional system, and MACD are used for the trends determination.
How to draw a trend line?
Most of the analysts build the trend lines through the extreme highs and lows, but it is better to draw them through the extreme points of the prescribed area. The thing is that spikes are connected with the short-term panic mood of the crowd and short-term speculations.
Victor Sperandeo in his book 'Trader Vic' offered another method of trend line construction. He suggests to draw a line of the upward trend from the lowest price of the period to the point of the lowest prices of the largest level which precedes the highest point of the period. The interval of the trend line between these two points may not have the crossing with the chart. The intersection with the trend line is the first sign that trend changes. The second is when the price did not overcome the previous upper price level. The third sign is that the price came below the previous lower level. This is a sign of the trend reversal.
Estimation of trend lines
The most important characteristic of a trend line is the value of its slope. The estimation of trend lines is made on following five factors: temporary base of trend line diagram, length, number of points touching the price chart, angle of slope and sales volumes.
With the increase of the temporary base of the diagram, the importance of trend line grows.
The longer the trend line is, the safer it is.
The bigger number of touching with the chart the trend line has, the safer it is.
The angle between the trend line and horizontal axis shows the intensity of emotions in the dominant mood of traders.
If the sales volumes advance with the price movement in the direction of trend line and decrease during corrections, this works as its confirmation. If the volumes increase with the trend line, there can be a reversal at the market, the falling of the sales volumes according to the movement of price chart from the trend line is also an alerting signal.
Reversals of trend line
Reversal at trend line can happen only in case if closing prices are on the other side of the trend line. Some analysts consider trend line as “broken” if the depth of penetration is no less than 2-3% points of the price (for example, $8-12 with $400 per troy ounce).
Rules for traders
1. Open positions which correspond with the direction of the trend line’s slope. If it is upwardly directed, look for the possibility to open a buy position, avoiding short positions. If it is downwardly directed, open short positions, avoiding purchases.
2. Trend lines set the [[Support and resistance levels|support and resistance levels]]. With the price growth during the upward trend, buy position should be opened, with the decrease below the trend line to set the stop loss.
3. The slope of the trend line anticipates the sharp reversals. If the slope of the line is more than 450, then put the order for position closing on the right side of trend line, and re-check every day the fulfillment of conditions.
4. After the reversal of the steep trend line, prices are often back to their last extreme value. With the correctional support till the previous price level, the fall in sales volume and the divergence of the indicator determine the appropriate moment for the opening of a short position. The price reduction to the previous low level after reversal of the downward trend line is the appropriate moment for the opening of the low risky position for the purchase.
5. The channel line should be parallel with the trend line and used for determination of the probable profit.
Channel line
The channel consists of two parallel lines between which there is a price chart. If the line of the upward trend goes through the lowest prices during reactions, the channel line is built through the upper prices of supports.
As well as the trend lines, the channel lines should be built through the extreme points of the temporary interval, not taking into account the intermediate extremes. The existence of the channel line strengthens the value of the corresponding trend line. The value of the channel line directly depends on its number of points which touch the price chart.
The wider the channel is, the stronger the trend is. Long position should be opened at the level which corresponds to the lowest quarter or half of the channel’s width with price increase; the short position is opened at the upper quarter or half of the channel’s width with price decline. The positions are closed at the opposite side of the channel.
Preliminary trend line
The trend line is usually drawn through two points at least. However, there is little-known technique of trend line’s construction, going through one point.
During the support period after the reversal of downward trend line, it can be assumed that downward trend ended and the upward started. Having drawn the line through the points of the last two tops, we have the channel line of a new trend. Having drawn the parallel line to it through the point which corresponds with the last low price, we get the line of a new trend. This line shows where we should wait for the next minimum of the price. The lines, which were built with the help of this technique and drawn through the lowest points, as a rule, work better than the lines, which were drawn through the highest points.
Line of the trend and scale
Why is the trend represented as a straight line? The linear models are simple; they are very easy to interpret and, moreover, can reflect the major tendencies, even if the process is nonlinear. On the other hand, the visible nonlinearity in the price diagram may turn out to be only as the result of “noise” or accidental fluctuations.
If there is a clear nonlinearity in the price chart, which sometimes is observed at the long periods of time or in the periods of strong price increase on the assets, the building of the line is complicated. Such changes of prices are usually described by the exponential dependence. In this case with the building of the price diagram it is better to use the logarithmic scale. The highs and lows at such diagrams are “placed” along the straight lines, and the technique of trend analysis described above can be used.
More about trend lines
The price level, which is below the point of the trend line’s reversal and is over the distance, which is equal to the distance measured vertically from the trend line to the last highest point, works for the assessment of the price change.
Image 2. Trendline breakdown.
Trend lines can be also built for the diagrams of purchase volume and for the indicators of the market. The line of the upward trend of the purchase volumes confirms the current trend of prices; the downward trend means the refuse of market participants to follow the current trend. Among the technical indicators the Relative Strength Index (RSI) gives a great correspondence with the analysis of trend lines. The reversal of its lines often happens before the trend line’s reversal.