Here are the details of the economic calendar for November 10, 2021:
The US inflation has risen to record levels since 1990. The level of consumer prices in October amounted to 6.2% against the expected 5.8% in annual terms. Statistics show that inflation may remain at a high level next year.
Investors were clearly not prepared for such a strong discrepancy in statistics. As a result, the US dollar still moved to strengthen its position in the currency market.
Analysis of trading charts from November 10:
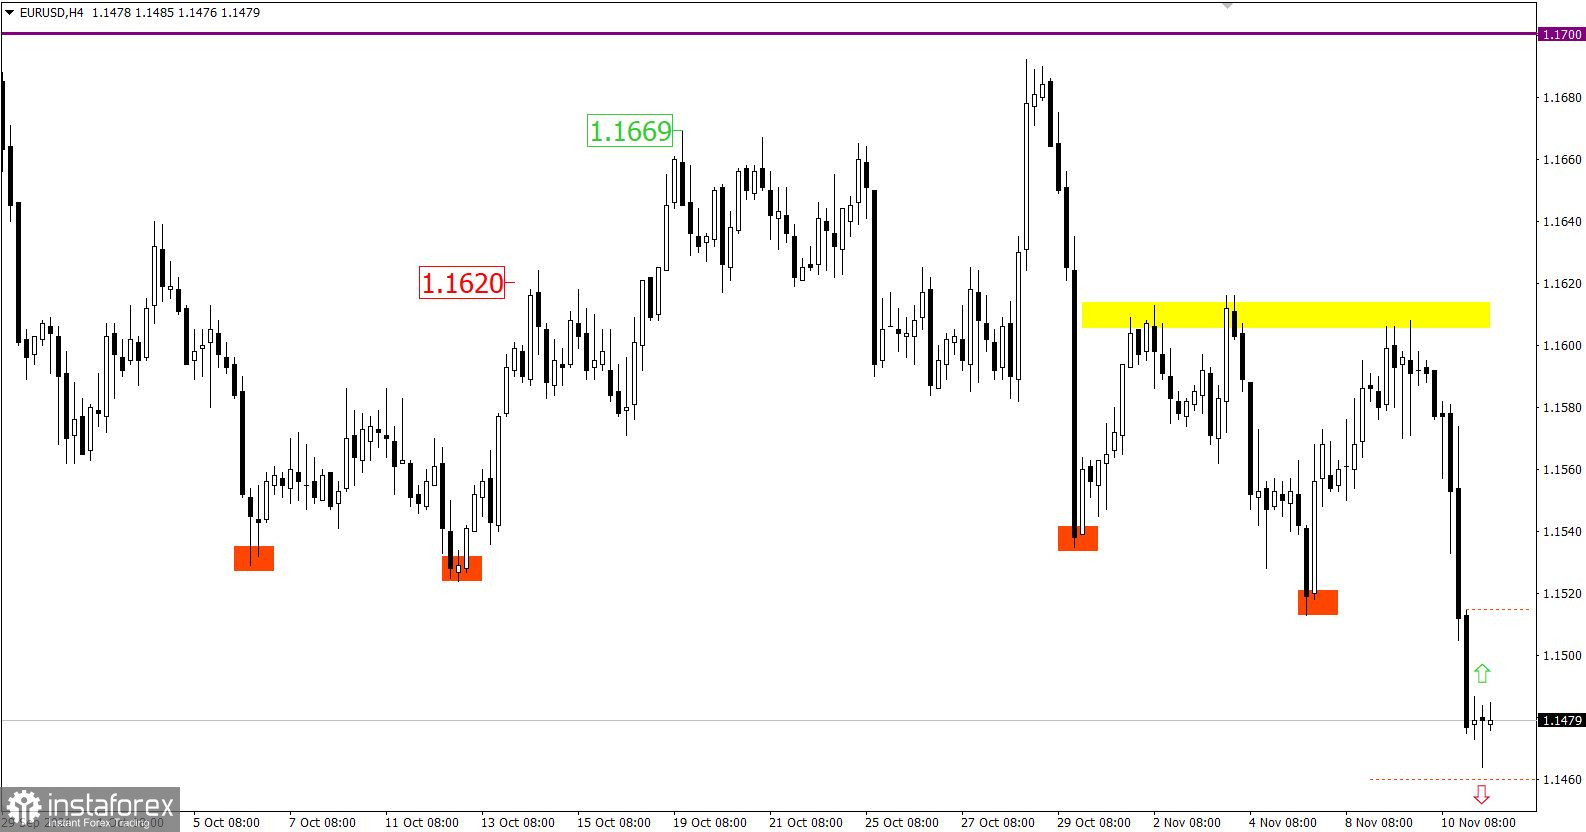
The Euro currency lost more than 110 points in value against the US dollar, which caused inertia in the market. As a result, the downward cycle from the beginning of June was extended to new levels, and the quote was in the area of July 2020.
The trading plan on November 10 considered the main trading tactics on the breakdown of one or another border of the established range of 1.1570/1.1605. As a result, the recommendations for entering a sell position below the level of 1.1565 made it possible to earn more than 90 points. This is $ 90 with a transaction volume of 1 Installot.
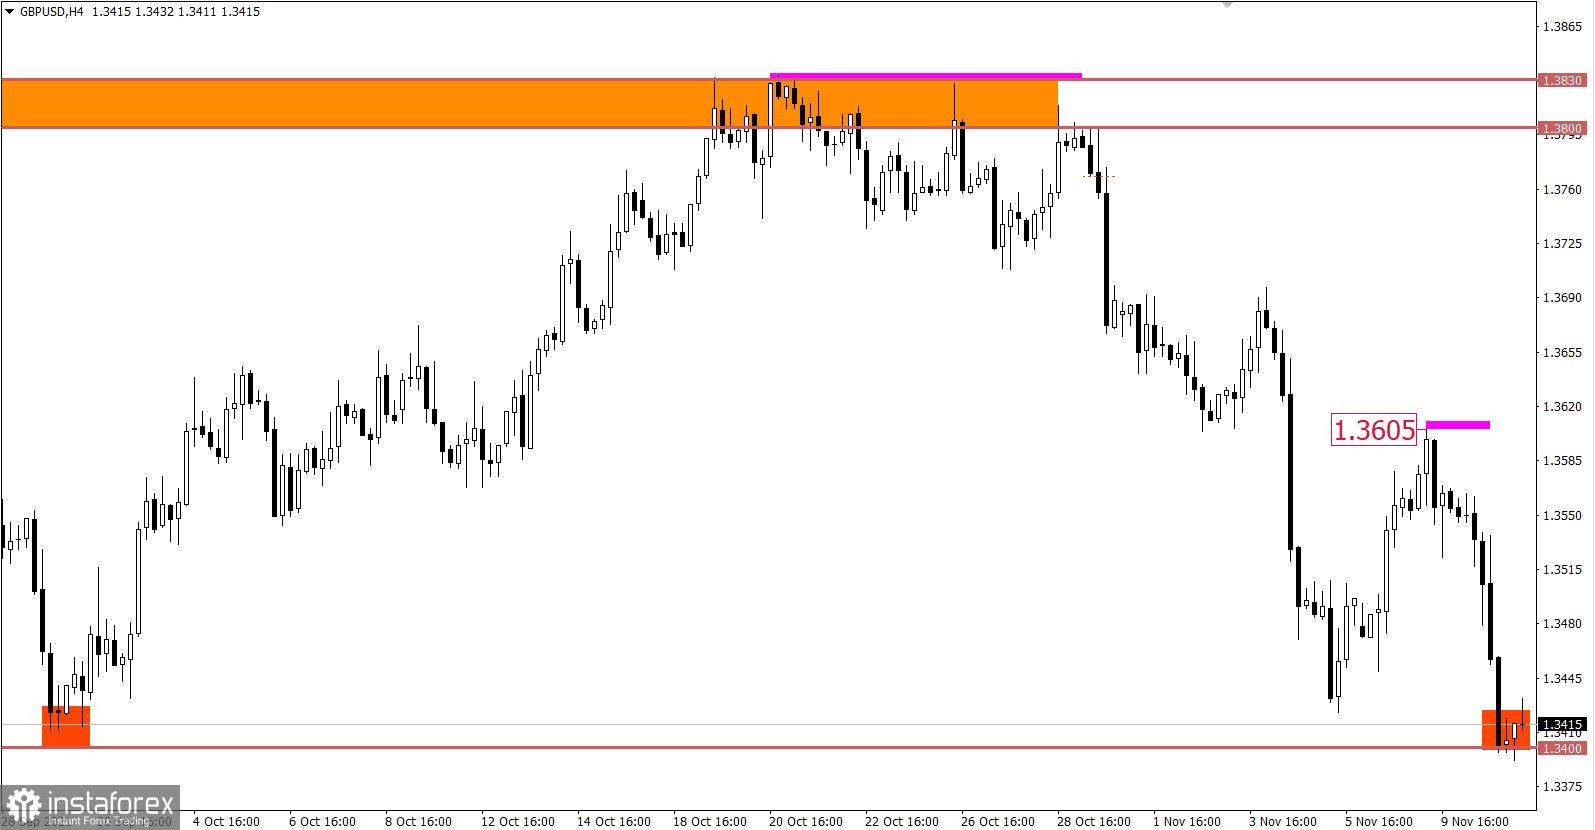
The GBP/USD pair has surpassed its market counterpart in terms of the intensity of the decline. Here, the weakening of the pound sterling amounted to more than 150 points yesterday, which allowed the pair to approach the support level of 1.3400.
The trading plan on November 10 considered a multi-stage approach, where we managed to take profit at first from the movement of 1.3545 ---> 1.3525, and then identify the main movement. As a result, it was possible to earn at least 100 points, which is $ 100 with a transaction volume of 1 Installot.
November 11 economic calendar:
Today is a national holiday in the United States. Veterans Day is celebrated annually on November 11. Due to this, exchanges, banks, funds are out of work.
This may negatively affect trade volumes, as the United States is considered a key player on the world stage.
In terms of statistical data, a preliminary estimate of UK GDP for the third quarter was published, which showed a slowdown in economic growth from 23.6% to 6.6%, which indicates a difficult situation in the United Kingdom.
At the same time, the UK's industrial production data were published, where a slowdown was recorded.
The market reacted negatively to the statistics, so the pound sterling was under pressure from sellers.
Trading plan for EUR/USD on November 11:
It can be assumed that the volume of short positions will temporarily decrease due to the holiday in the United States and the euro's high level of oversold. This will lead to a slowdown in the downward cycle, as well as a possible pullback.
The subsequent signal to sell the euro will come when the price is held below the level of 1.1460 in a four-hour period.
Trading plan for GBP/USD on November 11:
In this situation, we have a number of technical factors that put pressure on sellers. This is a high oversold level, the pivot point of 1.3400, and the lack of a pullback, but with all this, speculative interest remains in the market. Therefore, it is possible to consider subsequent sell positions, but only if the price is kept below the level of 1.3400 for a four-hour period. In all other scenarios, traders consider a technical pullback to at least the level of 1.3450.
What is reflected in the trading charts?
A candlestick chart view is graphical rectangles of white and black light, with sticks on top and bottom. When analyzing each candle in detail, you will see its characteristics of a relative period: the opening price, closing price, and maximum and minimum prices.
Horizontal levels are price coordinates, relative to which a stop or a price reversal may occur. These levels are called support and resistance in the market.
Circles and rectangles are highlighted examples where the price of the story unfolded. This color selection indicates horizontal lines that may put pressure on the quote in the future.
The up/down arrows are the reference points of the possible price direction in the future.