EUR/USD 5M
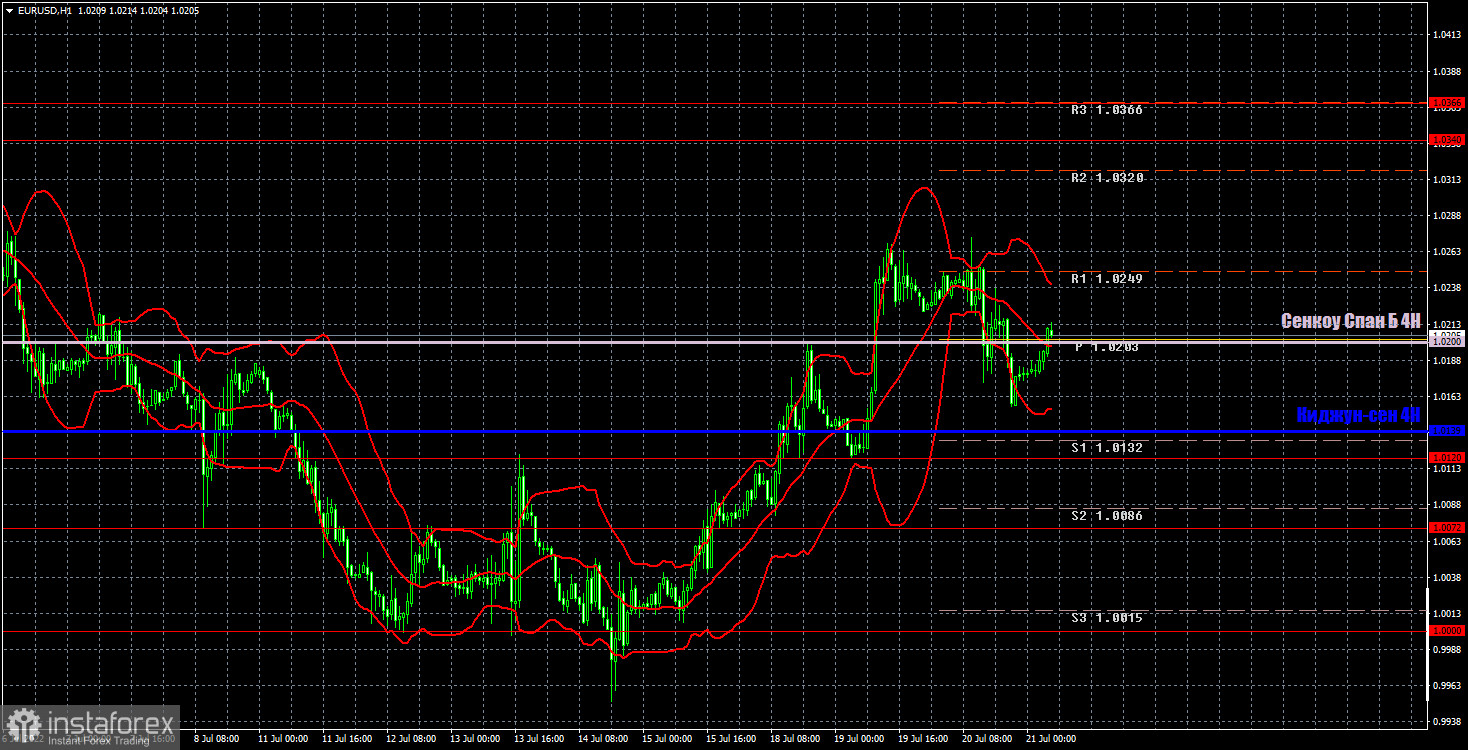
The EUR/USD pair slightly rolled back on Wednesday. Thus, it is now located near the Senkou Span B line, and its further prospects are still vague. Recall that the results of the European Central Bank meeting will be announced during the day, and a couple of hours after that, ECB President Christine Lagarde will make a speech. Recall also that the market no longer doubts the rate hike by 0.25%, and some experts expect a 0.5% increase. In any case, the first option has already been fully worked out by the market. Only the second option can discourage traders, respectively. Therefore, today, during the announcement of the results, a surge of volatility can be observed, but the market reaction is unlikely to be long-lasting (unless, of course, the rate is raised by 0.5%). Yesterday, important macroeconomic statistics were published only in the UK, so traders of the euro/dollar pair had nothing to react to during the day.
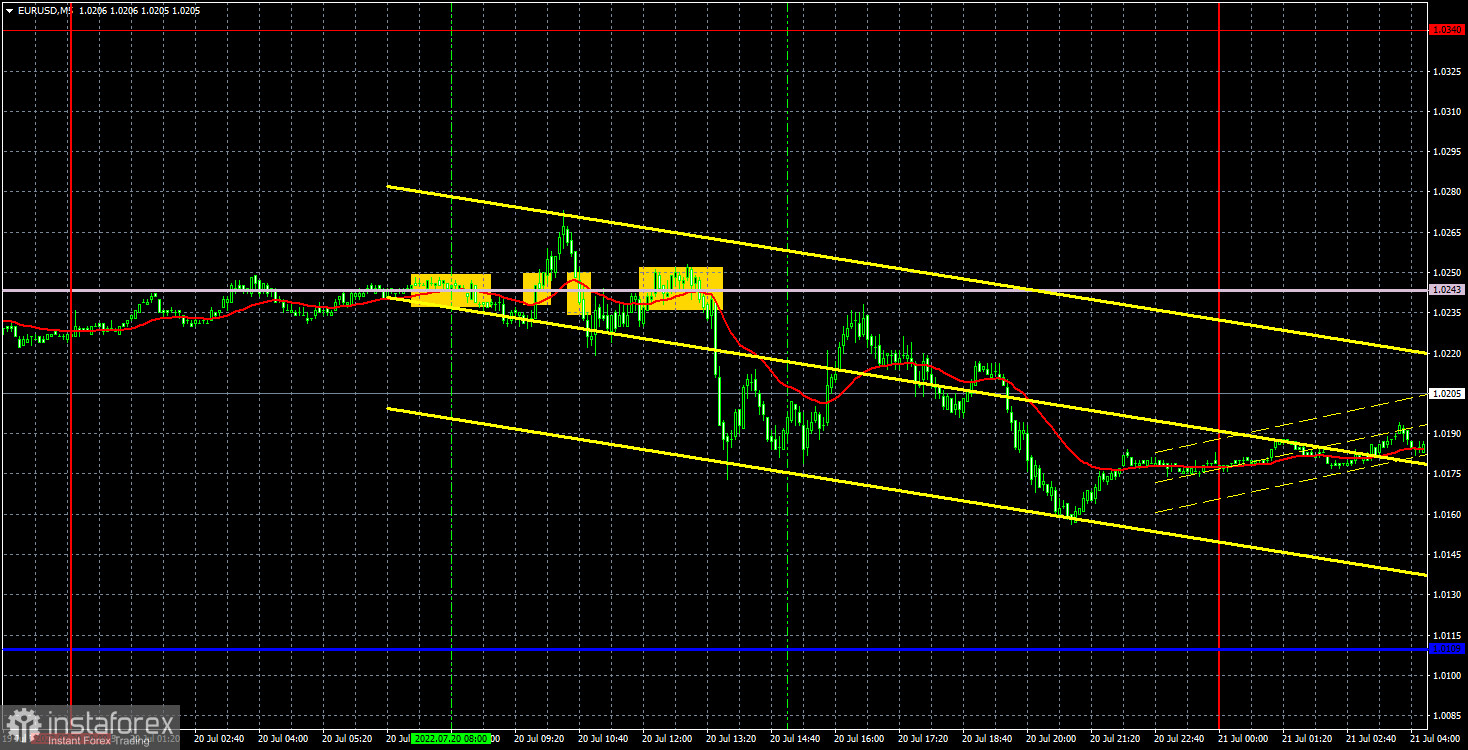
The movements shown by the pair on Wednesday cannot be called good. The pair was constantly correcting and rolling back, so trading was blatantly inconvenient. Four signals were formed near the Senkou Span B line during the European trading session, which indicates an almost flat movement at this time. The first three signals out of four were false. First, the pair bounced off the Senkou Span B line from above, but went down only 8 points, and then settled above it and went up only 23 points. In the second case, it was possible to at least set Stop Loss to breakeven, but with the first short position, a small loss was received. All subsequent signals near the Senkou Span B line should no longer be worked out, and there were no other signals during the day.
COT report:
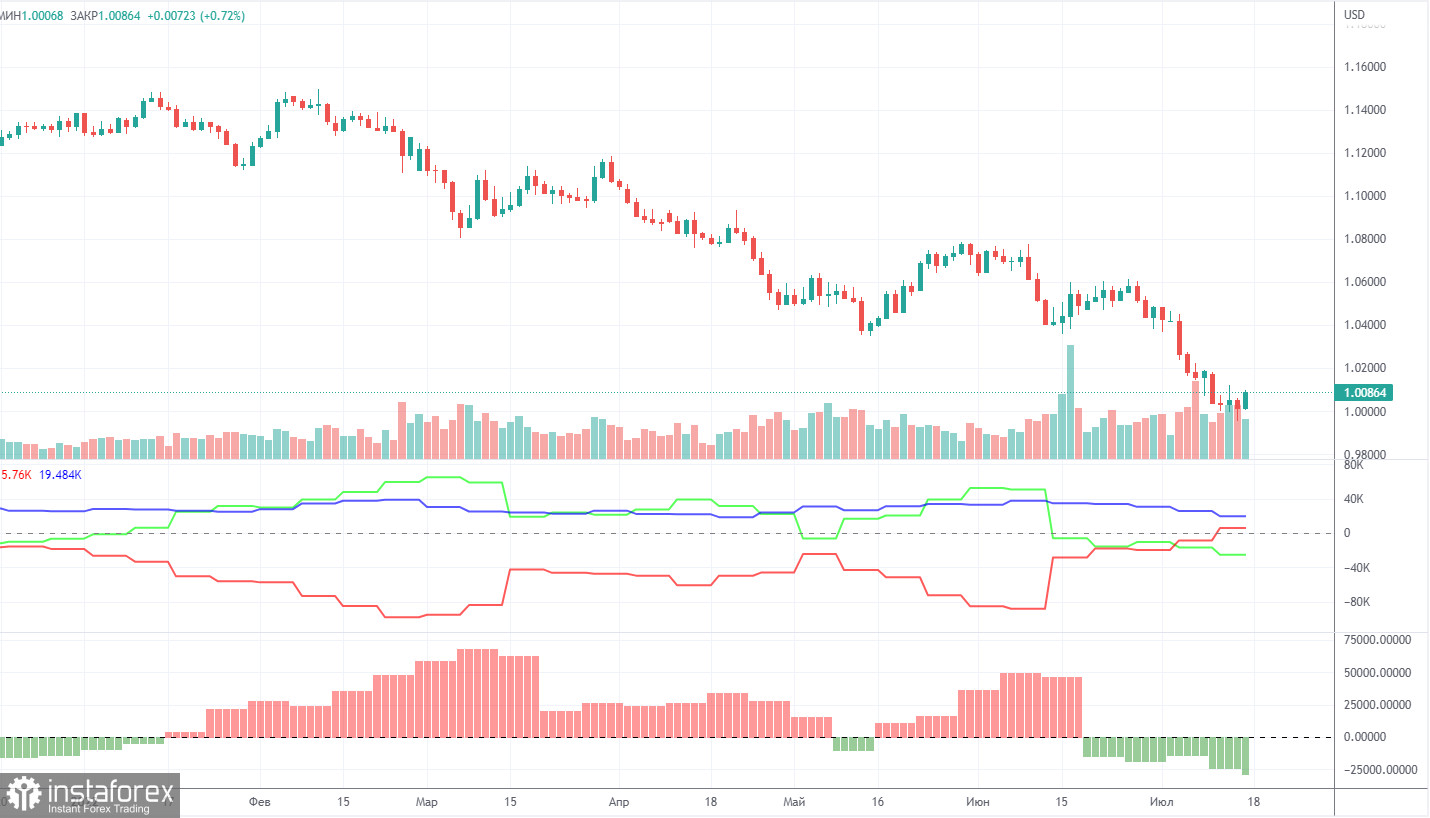
Commitment of Traders (COT) reports on the euro over the past six months have raised a huge number of questions. The chart above clearly shows that they showed a blatant bullish mood of commercial players, but at the same time, the euro was falling. At this time, the situation has changed, and NOT in favor of the euro. If earlier the mood was bullish, but the euro was falling, now the mood has become bearish and... the euro is also falling. Therefore, for the time being, we do not see any grounds for the euro's growth, because the vast majority of factors remain against it. During the reporting week, the number of long positions increased by 100, and the number of shorts in the non-commercial group increased by 8,500. Accordingly, the net position decreased again, by almost 8,500 contracts. The mood of the big players remains bearish and has even increased slightly in recent weeks. From our point of view, this fact very eloquently indicates that at this time even commercial traders do not believe in the euro. The number of longs is lower than the number of shorts for non-commercial traders by 25,000. Therefore, we can state that not only the demand for the US dollar remains high, but also the demand for the euro is quite low. This may lead to a new, even greater fall of the euro. In principle, over the past few months or even more, the euro has not been able to show even a tangible correction, not to mention something more. The highest upward movement was about 400 points.
We recommend to familiarize yourself with:
Overview of the EUR/USD pair. July 21. The ECB is unlikely to fundamentally change the mood of the market.
Overview of the GBP/USD pair. July 21. Election of the prime minister of Great Britain: there are three candidates left.
Forecast and trading signals for GBP/USD on July 21. Detailed analysis of the movement of the pair and trading transactions.
EUR/USD 1H
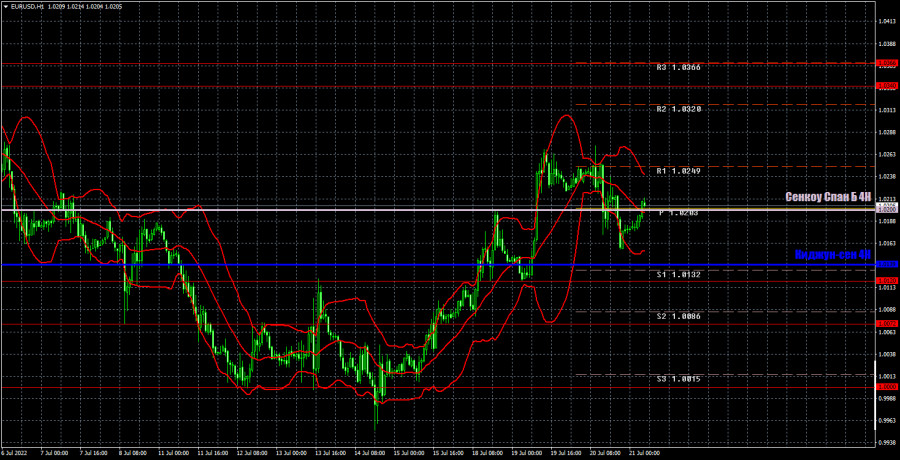
It is no longer possible to say that the downward trend continues on the hourly timeframe. Still, the pair went up by as much as 300 points. The euro could stop rising today, so you need to wait for the results of the ECB meeting and then draw certain conclusions. We highlight the following levels for trading on Thursday - 1.0000, 1.0072, 1.0120, 1.0340-1.0366, 1.0485, as well as Senkou Span B (1.0200) and Kijun-sen (1 .0139). Ichimoku indicator lines can move during the day, which should be taken into account when determining trading signals. There are also secondary support and resistance levels, but no signals are formed near them. Signals can be "rebounds" and "breakthroughs" extreme levels and lines. Do not forget about placing a Stop Loss order at breakeven if the price has gone in the right direction for 15 points. This will protect you against possible losses if the signal turns out to be false. There are no major reports or events scheduled for July 21 in the US. But the EU will announce the results of the ECB meeting, as well as Lagarde's press conference. Both of these events can cause a serious resonance in the market and a corresponding reaction.
Explanations for the chart:
Support and Resistance Levels are the levels that serve as targets when buying or selling the pair. You can place Take Profit near these levels.
Kijun-sen and Senkou Span B lines are lines of the Ichimoku indicator transferred to the hourly timeframe from the 4-hour one.
Support and resistance areas are areas from which the price has repeatedly rebounded off.
Yellow lines are trend lines, trend channels and any other technical patterns.
Indicator 1 on the COT charts is the size of the net position of each category of traders.
Indicator 2 on the COT charts is the size of the net position for the non-commercial group.