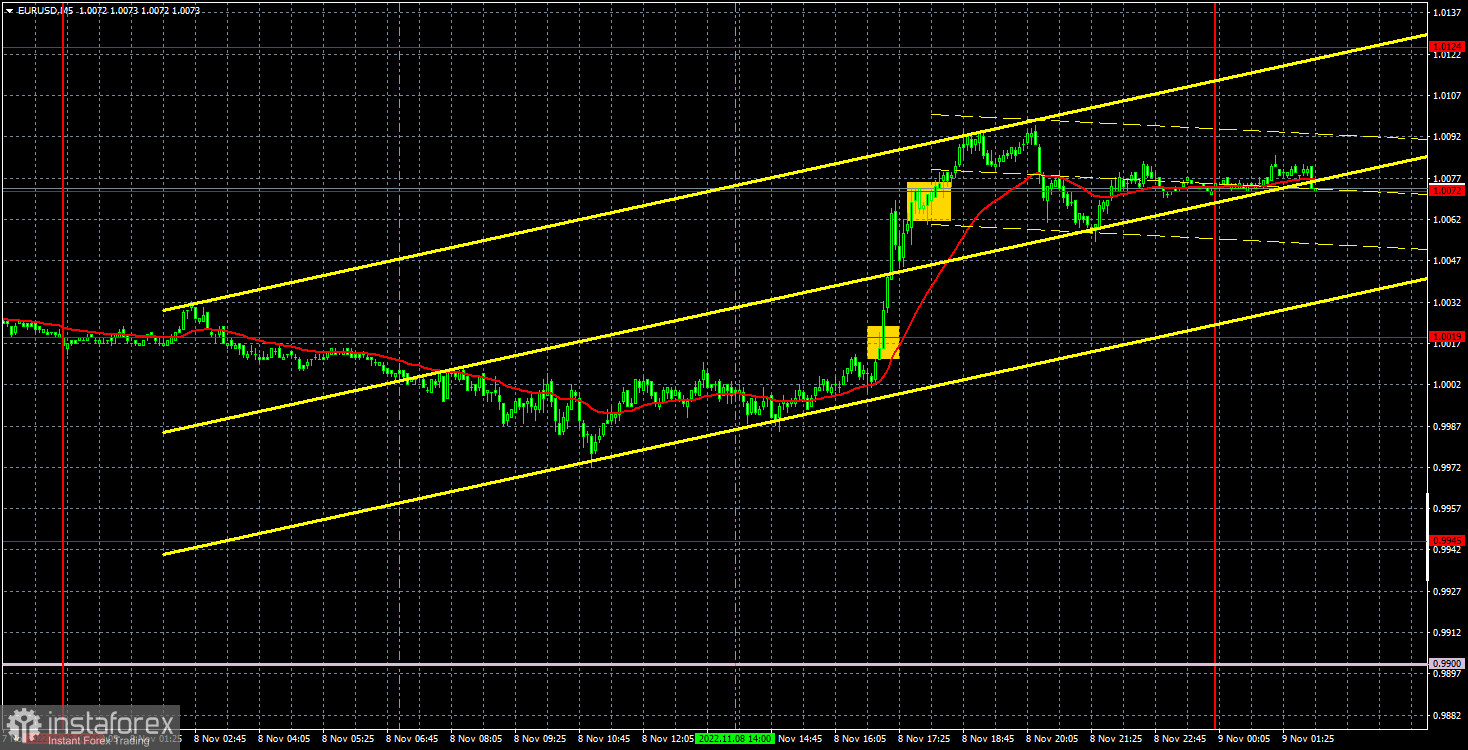
Analysis of EUR/USD, 5-minute chart
The euro/dollar pair continued its upward movement on Tuesday and added another 80 points in a day. Again, for no reason. The pair traded rather calmly for most of the day, but in the US trading session it soared up within a few hours. Thus, the euro is finally growing, but it is extremely difficult to explain this growth. On the one hand, it is good for the euro that it is able to grow not only when there are specific reasons for this. This gives reason to still expect a new upward trend. On the other hand, won't this growth be "accelerated" before a new protracted fall? Recall that many respected experts believe that the pair will fall, and will also continue to do so next year! In general, the situation is rather strange and ambiguous.
Only two trading signals were formed yesterday. First, the pair broke the level of 1.0019, and then 1.0072. Therefore, traders had to open a long position on the first signal, and close the position above the level of 1.0072, which brought them a profit of at least 55 points. Although the euro's current movement is strange, it still allows you to earn money, which means everything is fine.
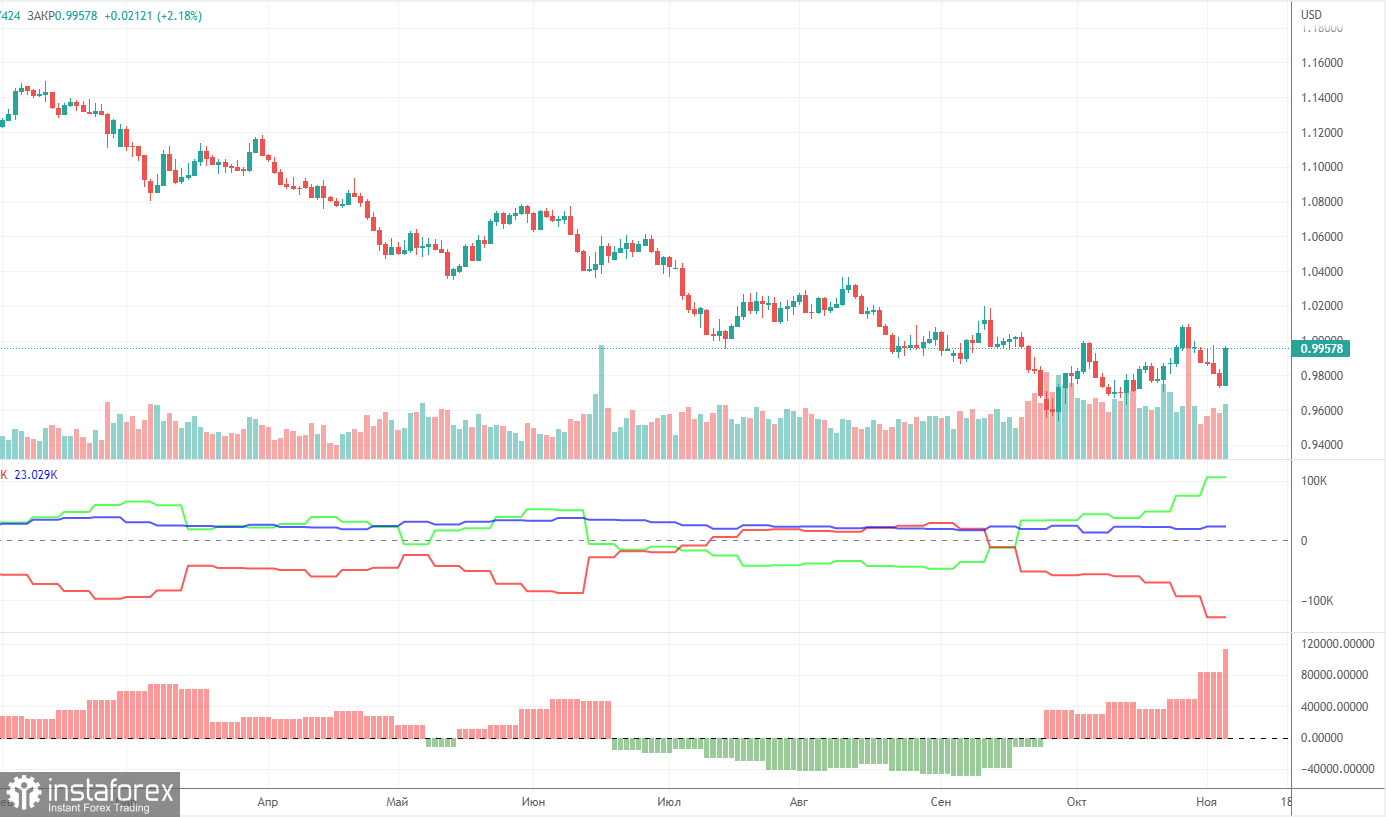
COT report
In 2022, the Commitment of Traders (COT) report for the euro is becoming more and more interesting. In the first part of the year, the reports were pointing to the bullish sentiment among professional traders. However, the euro was confidently losing value. Then, for several months, reports were reflecting bearish sentiment and the euro was also falling. Now, the net position of non-commercial traders is bullish again. The euro managed to rise above its 20-year low, adding 500 pips. This could be explained by the high demand for the US dollar amid the difficult geopolitical situation in the world. Even if demand for the euro is rising, high demand for the greenback prevents the euro from growing.
In the given period, the number of long positions initiated by non-commercial traders increased by 13,000, whereas the number of short orders declined by 17,000. As a result, the net position increased by 30,000 contracts. However, this could hardly affect the situation since the euro is still at the bottom. The second indicator in the chart above shows that the net position is now quite high, but a little higher there is a chart of the pair's movement itself and we can see that the euro again cannot benefit from this seemingly bullish factor. The number of longs exceeds the number of shorts by 106,000, but the euro is still trading low. Thus, the net position of non-commercial traders may go on rising without changing the market situation. If we look at the overall indicators of open longs and shorts across all categories of traders, then there are 23,000 more shorts (617,000 vs 594,000).
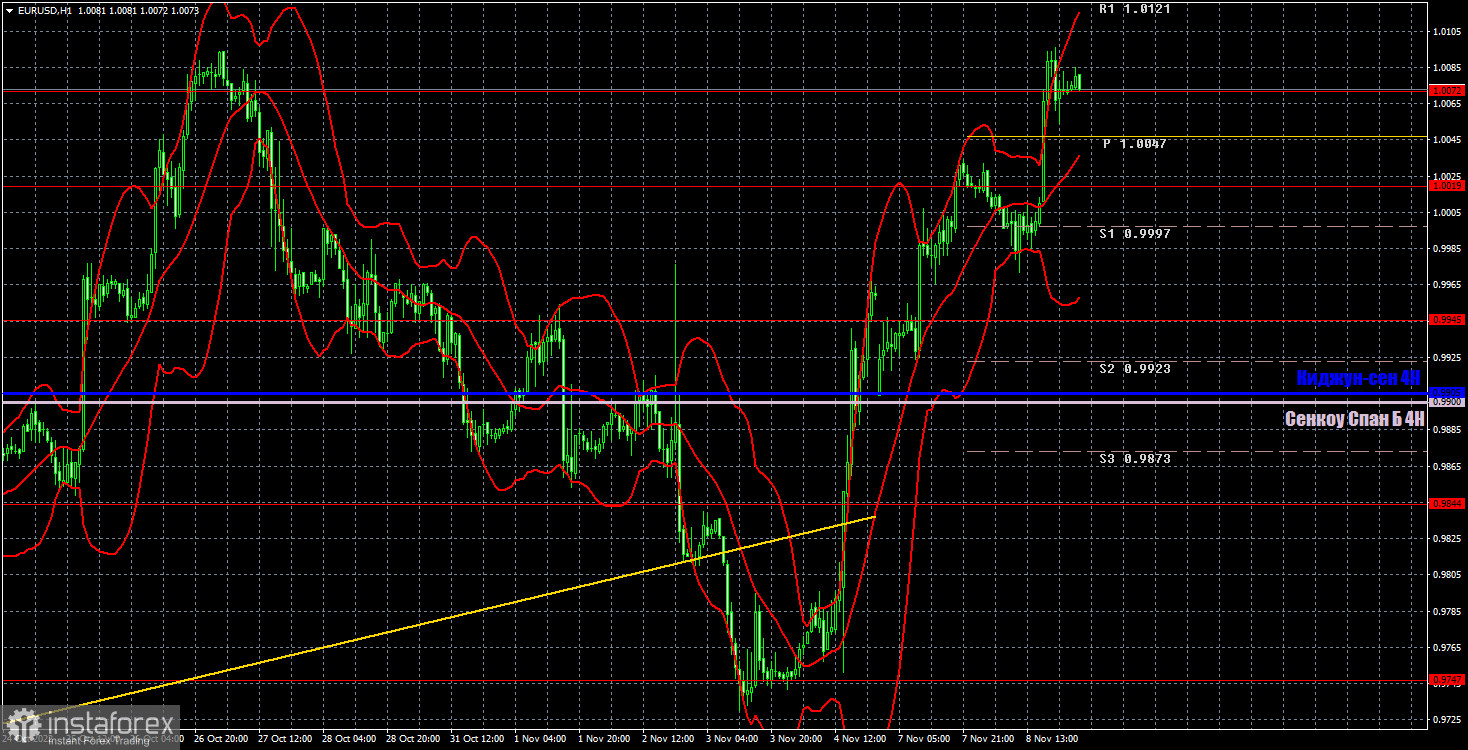
Analysis of EUR/USD, 1-hour chart
You can see that the pair continues to rise on the one-hour chart, has overcome the Ichimoku cloud on the 24-hour timeframe, as well as all the Ichimoku lines on the 4-hour timeframe. So far, the movement appears confident, but it is very difficult to explain it from a fundamental or macroeconomic point of view. It confuses us very much that the pair is growing for almost no reason. We can assume that these are echoes of the last week, but in this case it would be more logical if the pair fell rather than grew. On Wednesday, the pair may trade at the following levels: 0.9844, 0.9945, 1.0019, 1.0072, 1.0124, 1.0195, 1.0269, as well as the Senkou Span B (0.9900) and Kijun-sen lines (0.9905). Lines of the Ichimoku indicator may move during the day, which should be taken into account when determining trading signals. There are also support and resistance levels, but signals are not formed near these levels. Bounces and breakouts of the extreme levels and lines could act as signals. Don't forget about stop-loss orders, if the price covers 15 pips in the right direction. This will prevent you from losses in case of a false signal. No important events planned in the European Union and the United States. Thus, there will be nothing for traders to react to, but at the same time, the pair can continue to trade in a volatile manner and trend.
What we see on the trading charts:
Price levels of support and resistance are thick red lines, near which the movement may end. They do not provide trading signals.
The Kijun-sen and Senkou Span B lines are the lines of the Ichimoku indicator, moved to the one-hour chart from the 4-hour one. They are strong lines.
Extreme levels are thin red lines from which the price bounced earlier. They provide trading signals.
Yellow lines are trend lines, trend channels, and any other technical patterns.
Indicator 1 on the COT charts reflects the net position size of each category of traders.
Indicator 2 on the COT charts reflects the net position size for the non-commercial group.