empty
 
 
27.11.2022 01:17 PM
EUR/USD analysis for November 27. The ECB rate will increase, but the euro cannot increase.

This image is no longer relevant

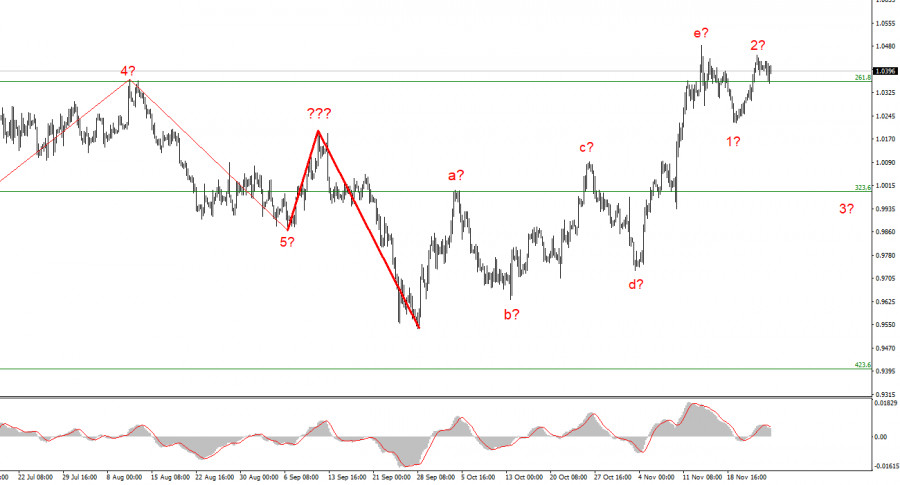
The wave marking on the euro/dollar instrument's 4-hour chart is convincing. The upward portion of the trend has corrected itself. Initially, I believed three waves would develop, but it is now abundantly clear that there are five waves. As a result, the waves a, b, c, d, and e have a complex correction structure. If this supposition is accurate, the building of this structure may have already been finished since the peak of wave e is higher than the peak of wave C. In this instance, it is anticipated that we will construct at least three waves downward, but if the most recent phase of the trend is corrective, the subsequent phase will probably be impulsive. Therefore, I am preparing for a new significant decline in the instrument. The market will be ready to sell when a further attempt to breach the 1.0359 level, which corresponds to 261.8% Fibonacci, is successful. The peak of the anticipated wave e was still present, so removing quotes from the lows this week did not violate the wave marking. As a new downward trend segment, most likely segment 2 or b, the most recent increase in quotes can be seen as an internal correction wave. Wave e and the upward portion of the trend will likely take a more extended form if an attempt to break through its current peak is successful.

Rates will keep rising, according to an ECB vice president.

This week, the euro/dollar instrument experienced positive dynamics. The demand for the euro currency was increasing despite the absence of reports and news. This allowed the instrument to develop an upward wave that still needed to deviate from the established wave pattern. However, the instrument's decline should start as early as Monday or Tuesday to preserve the integrity of the wave marking. A wave 3 or C is supposed to be built right now.

The ECB Vice President Louis de Guindos' speech last week was the most interesting for the euro. There were two performances, though they were barely distinguishable from one another. According to De Guindos, the European Central Bank's interest rate will increase in the upcoming months because the European Union's inflation rate is still "indecently high," and the slowdown in economic activity cannot result in a decrease in the consumer price index. As no one who participated in the foreign exchange market questioned further tightening monetary policy, I cannot say that de Guindos' statement sparked a commotion there. The likelihood that the rate will increase further, though, is growing. The euro currency benefits from this, but wave analysis and the news background are now at odds. While the news background suggests an increase, the waves suggest a decrease. We may see both in the end. The tool can create a third wave of a descending trend before starting a new upward trend segment. However, a descending wave needs to be constructed first. If not, the wave markup might become much more difficult to read.

This image is no longer relevant

Conclusions in general

Based on the analysis, the construction of the upward trend section is complete and has become more complicated with five waves. As a result, I suggest making sales with targets close to the estimated 0.9994 level, or 323.6% Fibonacci. There is a chance that the upward section of the trend will become more complicated and take on an extended form, but this chance is currently at most 10%.

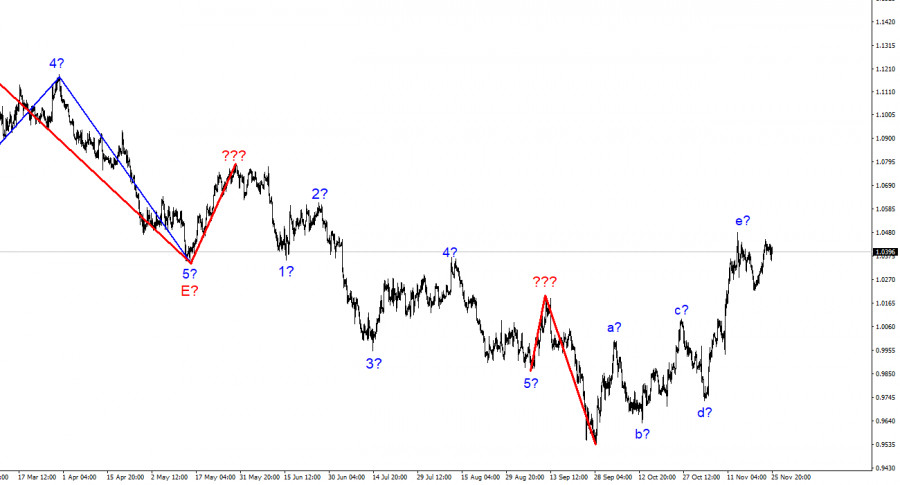
The wave marking of the descending trend segment becomes more intricate and lengthens at the higher wave scale. The a-b-c-d-e structure is most likely represented by the five upward waves we observed. After the construction of this section is finished, work on a downward trend section may resume.

Chin Zhao,
Especialista em análise na InstaForex
© 2007-2023
EURUSD
Euro vs US Dollar
Select timeframe
5
min
15
min
30
min
1
hour
4
hours
1
day
1
week
Start trade
Start trade
  • Grand Choice
    Contest by
    InstaForex
    InstaForex always strives to help you
    fulfill your biggest dreams.
    PARTICIPE DO CONCURSO
  • Chancy Deposit
    Deposite US $ 3.000 em sua conta e receba $1000 mais!
    Em Abril nós sorteamos $1000 na campanha Chancy Deposit!
    Tenha a chance de ganhar, depositando $3,000 em sua conta de negociação. Após cumprir essa condição, você se torna um participante da campanha.
    PARTICIPE DO CONCURSO
  • Trade Wise, Win Device
    Abasteça a sua conta com pelo menos $500, inscreva-se no concurso e tenha a chance de ganhar dispositivos móveis.
    PARTICIPE DO CONCURSO
  • Bônus de 100%
    Sua oportunidade única de receber um bônus de 100% em seu depósito
    RECEBA O BÔNUS
  • Bônus de 55%
    Solicite um bônus de 55% em cada depósito
    RECEBA O BÔNUS
  • Bônus de 30%
    Receba um bônus de 30% toda vez que você fizer um depósito em sua conta
    RECEBA O BÔNUS

Recommended Stories

Análise de onda Elliott de EUR/USD para 31 de março de 2023.

EUR/USD está desafiando a resistência em 1,0930. Uma quebra acima aqui abrirá a porta para um movimento mais alto em direção à resistência em 1,1033, no caminho mais alto para

Torben Melsted 16:54 2023-03-31 UTC+2

Análise de onda Elliott de EUR/JPY para 30 de março de 2023.

O quadro de longo prazo do EUR/JPY mostra que um triângulo de vários anos foi concluído com o teste de 114,20 em maio de 2020 e uma nova corrida impulsiva

Torben Melsted 15:17 2023-03-30 UTC+2

Análise da onda Elliott do USD/JPY para 30 de março de 2023

Hoje vamos dar uma olhada no cenário de longo prazo do USD/JPY. Após o pico em outubro de 2022 em 151,94, vimos a onda A mover-se para baixo para testar

Torben Melsted 15:15 2023-03-30 UTC+2

Análise de onda de Elliott de EUR/USD para 23 de março de 2023.

O EUR/USD quebrou claramente acima da resistência em 1,0804 para confirmar que a onda 4 foi concluída com o teste de 1,0516 e uma nova alta impulsiva na onda

Torben Melsted 13:18 2023-03-23 UTC+2

GBP/USD. Análise para 22 de março. A inflação britânica está subindo novamente.

A análise das ondas para o par libra/dólar agora parece desafiadora, mas não exige nenhum esclarecimento. Os padrões de onda do euro e da libra diferem um pouco, mas ambos

Chin Zhao 20:46 2023-03-22 UTC+2

GBP/USD. Análise de 21 de março de 2023.

A análise das ondas para o par libra/dólar agora parece desafiadora, mas não exige nenhum esclarecimento. Os padrões de onda do euro e da libra diferem um pouco, mas ambos

Chin Zhao 20:09 2023-03-21 UTC+2

Análise da onda Elliott do EUR/JPY para 20 de março de 2023.

O EUR/JPY finalmente quebrou abaixo da linha de suporte da bandeira e deve continuar mais baixo em direção ao nosso alvo de longo prazo perto de 133,55, com o primeiro

Torben Melsted 14:35 2023-03-20 UTC+2

Análise de onda de Elliott do GBP/JPY para 16 de março de 2023.

Esperamos que o GBP/JPY continue a pressão negativa e uma quebra abaixo do apoio perto de 159,20 para um declínio em direção à meta de 145,76. A curto prazo, vemos

Torben Melsted 20:00 2023-03-16 UTC+2

Análise de onda de Elliott do EUR/JPY para 16 de março de 2023.

O EUR/JPY está testando a linha de suporte da bandeira e provavelmente quebrará abaixo desta linha de suporte em breve para confirmar a próxima parte da correção descendente em direção

Torben Melsted 14:24 2023-03-16 UTC+2

Análise da onda Elliott do NZD/USD para 15 de março de 2023.

O NZD/USD está pronto para o próximo avanço impulsivo em direção a pelo menos 0,7706 e possivelmente até mais perto de 0,8214. Nossa melhor interpretação do rally desde a baixa

Torben Melsted 14:26 2023-03-15 UTC+2
Não pode falar agora?
Faça sua pergunta no chat.