Analyzing trades on Thursday:
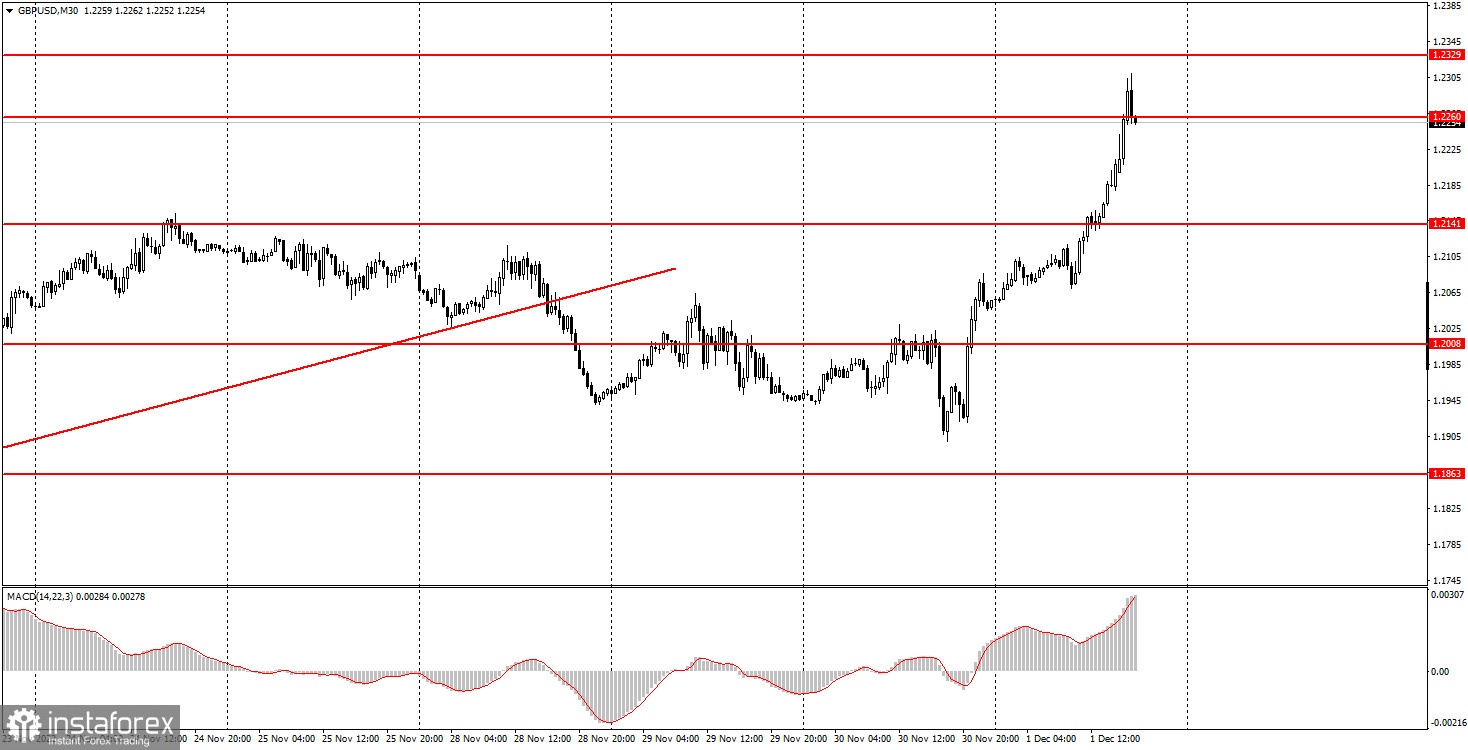
GBP/USD on 30M chart
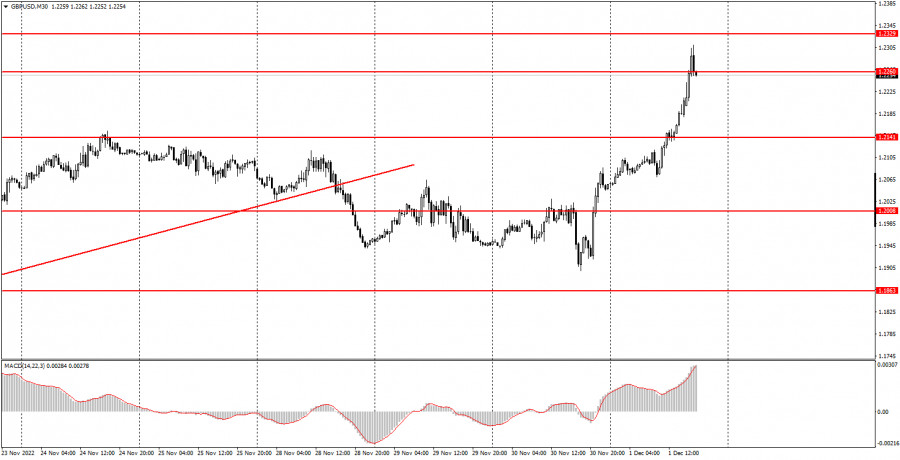
GBP/USD surged on Thursday. The pair gained at least 200 points during the day. And this happened despite the fact that Britain had only released an index of business activity in the manufacturing sector, which slightly increased but still remained below the key level of 50.0, while more or less interesting reports were released in America just a couple of hours ago. So why was the pound rising all day? We already mentioned that Federal Reserve Chairman Jerome Powell's speech on Wednesday was very important, but essentially he did not say anything that was particularly new. And certainly there was much less dovish information from him than that of hawkish. Anyway, in any case there was no reason and grounds for the dollar to fall by 360 points, if you start with yesterday evening. However it rose anyway, so now we can speak about restoring the uptrend, the normal correction didn't work out, and the pair's movement during the last weeks barely corresponds to the notions of "logic" and "reasonability".
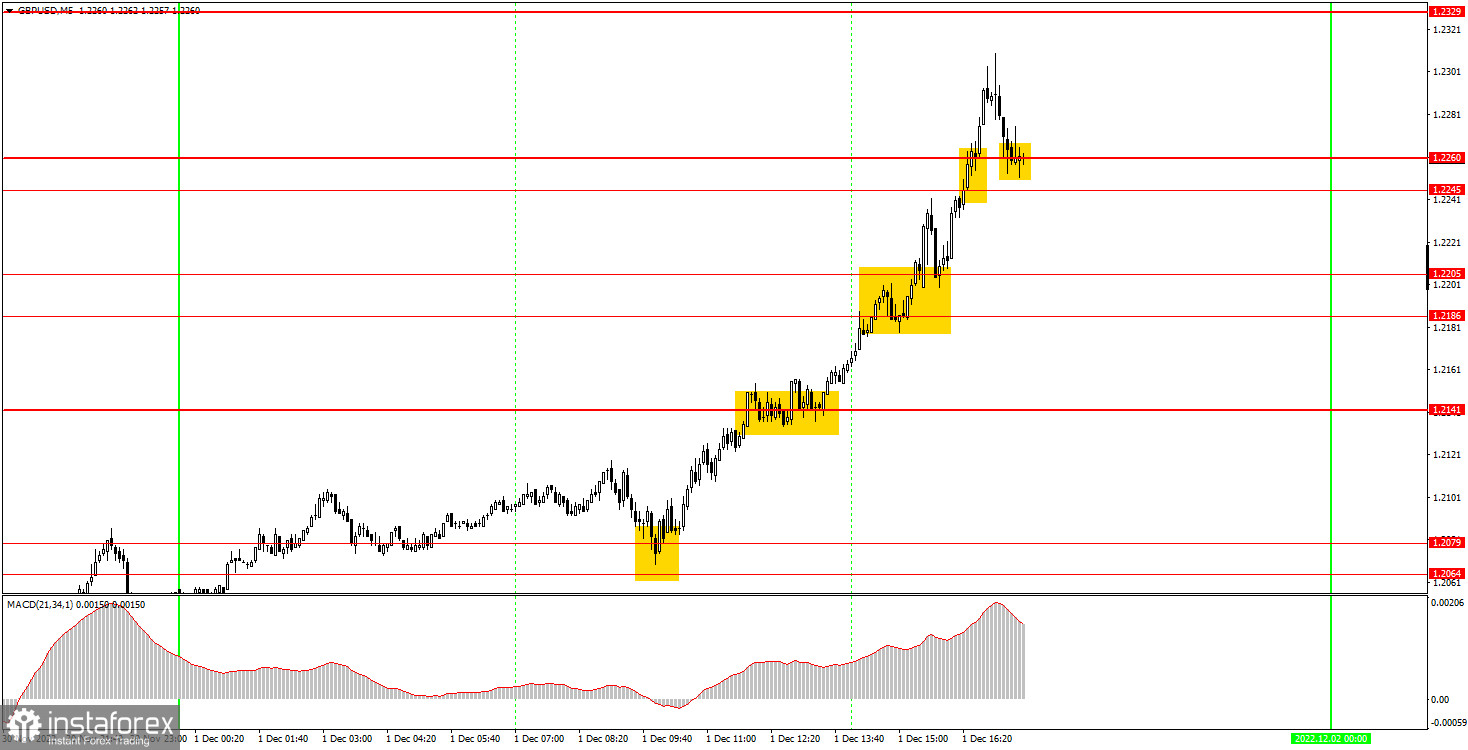
GBP/USD on M5 chart
Trading signals on the 5-minute chart were just fine since the pair was moving only in one direction all day. The first buy signal was near the area of 1.2064-1.2079 and, in fact, it was the only signal, which beginners could work out, because all the following signals were also for long positions. The pair passed over the levels of 1.2141, 1.2186, 1.2205, 1.2245, 1.2260, and stopped only at the last one. Traders could close the long position there. The profit was about 170 pips. Once again, please remember that trading is easy and simple when the pair is trading volatile and is exhibiting a trend.
Trading tips on Friday:
The pair started to form a downtrend on the 30-minute time chart, and quickly finished its "ordeal" with it. The pair grew by 360 points in less than a day, breaking the current technical picture, and with it a new, incipient downtrend. The most interesting thing is that we don't know if the pound will still continue to rise. On the 5-minute chart on Friday, it is recommended to trade at the levels 1.1716, 1.1793, 1.1863-1.1877, 1.1950-1.1957, 1.2064-1.2079 and 1.2141. As soon as the price passes 20 pips in the right direction, you should set a Stop Loss to breakeven. On Friday, there will be no important events in the UK, but at least in the US we have the NonFarm Payrolls report, which is very important and may provoke a new, strong, but possibly illogical market reaction.
Basic rules of the trading system:
1) The strength of the signal is determined by the time it took the signal to form (a rebound or a breakout of the level). The quicker it is formed, the stronger the signal is.
2) If two or more positions were opened near a certain level based on a false signal (which did not trigger a Take Profit or test the nearest target level), then all subsequent signals at this level should be ignored.
3) When trading flat, a pair can form multiple false signals or not form them at all. In any case, it is better to stop trading at the first sign of a flat movement.
4) Trades should be opened in the period between the start of the European session and the middle of the US trading hours when all positions must be closed manually.
5) You can trade using signals from the MACD indicator on the 30-minute time frame only amid strong volatility and a clear trend that should be confirmed by a trendline or a trend channel.
6) If two levels are located too close to each other (from 5 to 15 pips), they should be considered support and resistance levels.
On the chart:
Support and Resistance levels are the levels that serve as targets when buying or selling the pair. You can place Take Profit near these levels.
Red lines are channels or trend lines that display the current trend and show in which direction it is better to trade now.
The MACD indicator (14, 22, and 3) consists of a histogram and a signal line. When they cross, this is a signal to enter the market. It is recommended to use this indicator in combination with trend patterns (channels and trendlines).
Important announcements and economic reports that can be found on the economic calendar can seriously influence the trajectory of a currency pair. Therefore, at the time of their release, we recommend trading as carefully as possible or exiting the market in order to avoid sharp price fluctuations.
Beginners on Forex should remember that not every single trade has to be profitable. The development of a clear strategy and money management is the key to success in trading over a long period of time.