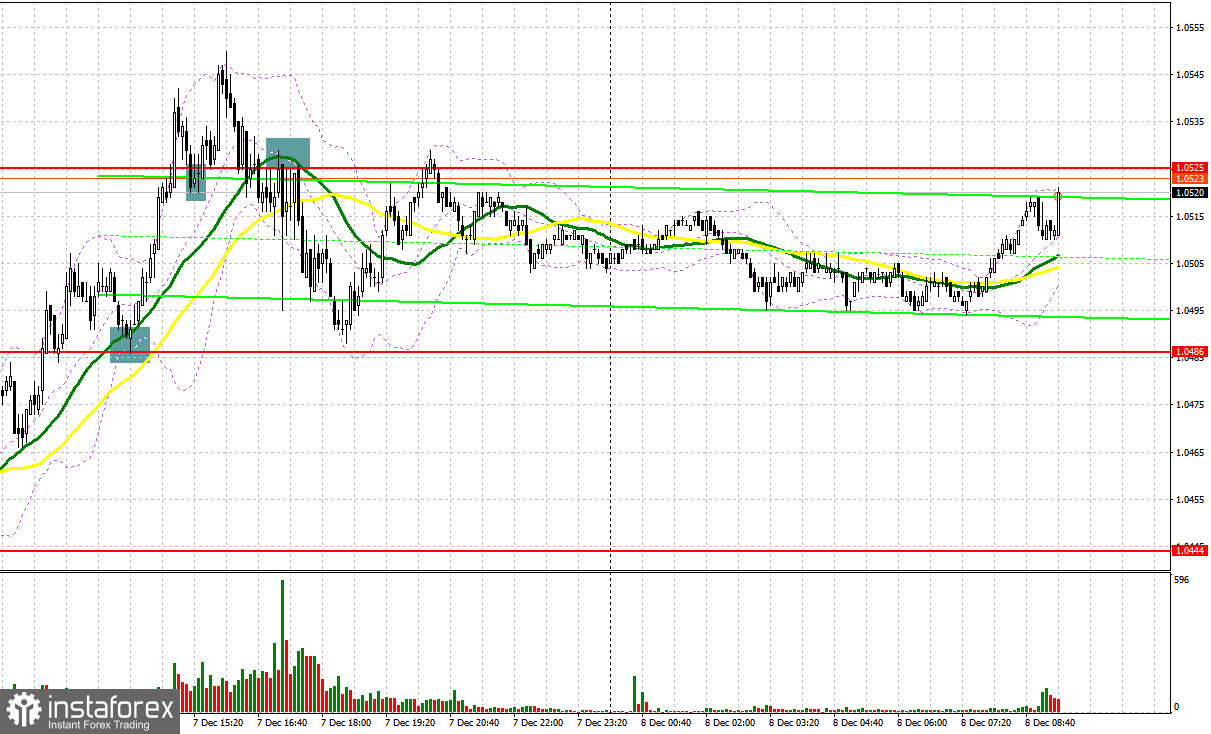
Yesterday, a few entry signals were made. Let's look at the M5 chart to get a picture of what happened. In the previous review, we focused on the mark of 1.0482 where we considered entering the market. Growth and a false breakout through the mark generated a sell signal. Following the release of upbeat data in the eurozone, the price retested and broke through the level of 1.0482. As a result, a bullish correction occurred. Consolidation and a retest of the level of 1.0486 to the downside produced a buy signal. The pair went up by above 50 pips. Meanwhile, when the price settled at 1.0525, a buy signal brought a profit of just 25 pips. In the middle of the North American session, the bears regained control over the mark of 1.0525, where a false breakout made a sell signal. Eventually, the quote fell by about 30 pips.
When to go long on EUR/USD:
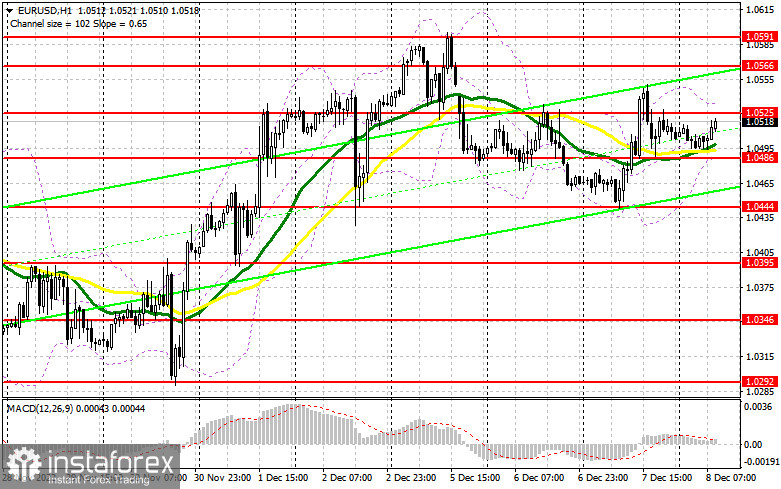
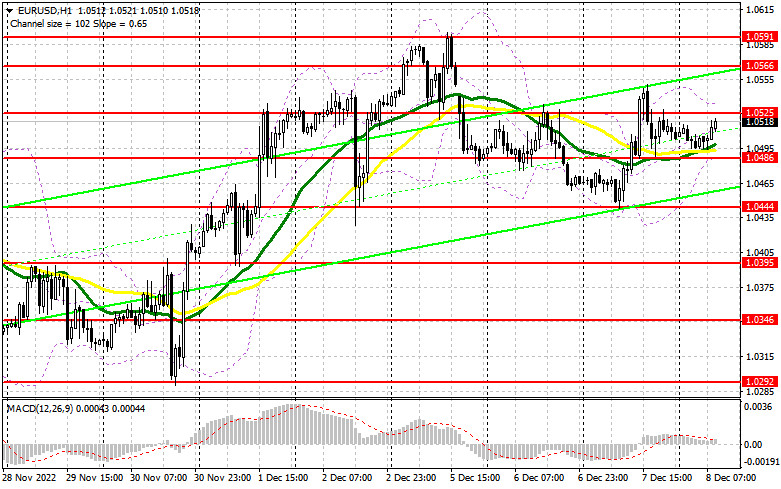
The macroeconomic calendar will be empty in the first half of the day. Therefore, the market will focus on ECB President Laragde's speech. Her dovish statement is likely to cause a fall in EUR/USD. If the pair goes down in the first half of the day, a false breakout through 1.0486 support will generate a buy signal. The pair will get back to the level of 1.0525. A breakout and test of the mark to the downside will create an additional entry buy point with the target at the high of 1.0566, and bullish sentiment will increase. A breakout through the barrier will trigger a row of bearish stop orders and produce an additional entry signal with the target at the monthly high of 1.0591 where a profit-taking process may begin. If EUR/USD goes down when there is no bullish activity at 1.0486, the pressure on the pair will remain high. Control over the market will then be in the sellers' hands. A breakout through 1.0486 will lead to the pair's fall to 1.0444 support where long positions could be considered after a false breakout. Also, it will become possible to buy EUR/USD immediately after a bounce off 1.0395, or even lower, in the area of 1.0346, allowing a bullish correction of 30-35 pips intraday.
When to go short on EUR/USD:
The sellers prefer to act when necessary. The balance of trading forces is likely to continue until next week when central banks announce their interest rate decisions. Today, the bears should protect the nearest resistance level of 1.0525 and take the support level of 1.0486 under their control. Growth and a false breakout through 1.0525, following Lagarde's speech, may cause an increase in selling pressure. The pair will fall to 1.0486. A breakout and a retest of the mark will produce an additional sell signal and trigger a correction to 1.0444. Consolidation below this level will result in an even deeper bearish correction to 1.0395 where the profit-taking stage may begin. The bear market will get stronger. The most distant target is seen at 1.0346. This is where the November uptrend may stop. If EUR/USD rises during the European session when there is no bearish activity at 1.0525, the pair will retest the mark of 1.0566. It would be to go short there only if consolidation fails. It will also become possible to sell EUR/USD immediately after a bounce off the 1.0591 high, allowing a bearish correction of 30-35 pips.
Commitments of Traders:
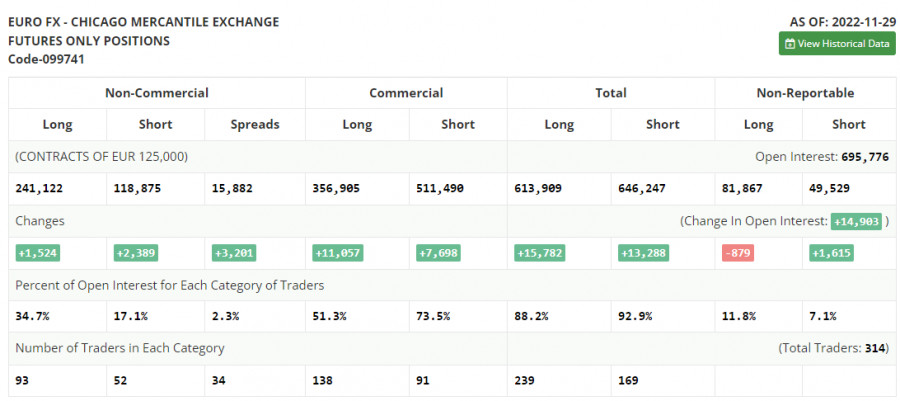
The COT report for November 29 logged an increase in both long and short positions. Jerome Powell's statement last week helped retain demand for risk assets, including the euro. Given that the pair has been on the rise since November, more and more traders are now willing to sell the instrument at the current price. The latest macro data from the US, namely, business activity and labor market indicators, allows traders to expect a continuation of the tightening cycle in the US next year. In this light, there is no good reason to open long positions in the medium term, as the higher the euro climbs, the deeper it will fall. This trading week is likely to be calm. So, traders may shift their attention to the FOMC meeting, due on December 13-14. According to the COT report, long non-commercial positions increased by 1,524 to 241,122, and short non-commercial positions grew by 2,389 to 118,875. The weekly total non-commercial net position decreased slightly to 122,234 from 123,112. This indicates that investors are no longer in such a hurry to buy back the undervalued euro as a few months earlier. The weekly closing price advanced to 1.0342 from 1.0315.
Indicator signals:
Moving averages
Trading is carried out above the 30-day and 50-day moving averages, reflecting stabilization in the market.
Note: The period and prices of moving averages are viewed by the author on the hourly chart and differ from the general definition of classic daily moving averages on the daily chart.
Bollinger Bands
Resistance stands at 1.0535, in line with the upper band. Support is seen at 1.0486, in line with the lower band.
Indicator description:
- Moving average (MA) determines the current trend by smoothing volatility and noise. Period 50. Colored yellow on the chart.
- Moving average (MA) determines the current trend by smoothing volatility and noise. Period 30. Colored green on the chart.
- Moving Average Convergence/Divergence (MACD). Fast EMA 12. Slow EMA 26. SMA 9.
- Bollinger Bands. Period 20
- Non-commercial traders are speculators such as individual traders, hedge funds, and large institutions who use the futures market for speculative purposes and meet certain requirements.
- Long non-commercial positions are the total long position of non-commercial traders.
- Non-commercial short positions are the total short position of non-commercial traders.