Long-term outlook.
The EUR/USD currency pair has been trading higher for the majority of this week, only slightly moving back down on Friday. The unjustified growth of the European currency was frequently mentioned in our daily articles. Now take a look at the 24-hour TF. The complete most recent growth, which totals about 400 points, fits perfectly within the definition of "swing." Or a wide flat. Recently, the market has tried twice to break through the 50.0% Fibonacci level but failed. Near this level, the upward movement's penultimate round also came to a stop. In recent months, the long-term value of the pound sterling has also remained unchanged. Thus, several conclusions can be drawn. First off, there is a strong likelihood that both main pairs will move into a long-term flat. Before the consolidation phase started, we anticipated a stronger downward correction, but the market appears to have made a different decision and started consolidating right away. Second, from a basic standpoint, the recent increases in the value of the euro and the pound are unjustified; however, from a technical standpoint, everything is in order. Now, a rebound off the 50.0% mark might result in a decline to 1.0530, and such a movement might also appear irrational. The pair, however, does not require compelling reasons to move from one of its borders to another if it is trading in a side channel.
Only the report on inflation in the European Union can be highlighted as one of the significant events from last week. Experts predicted that the consumer price index would decline to 7.1–7.4% y/y, but it decreased to 6.9%. Since a value of 8.5% was reported in February, this is a significant slowdown. Inflation decreased by 1.6% in one month, which is a significant amount. If the euro calmly grew on Thursday in response to a similar report on German inflation, which was very strange, then traders on Friday could no longer ignore the fact that the likelihood of an ECB rate increase of 0.5% in May had significantly decreased. The European currency also has fewer and fewer opportunities for growth as inflation declines.
COT evaluation.
A new COT report for March 28 was made public on Friday. The CFTC has made up for lost time and is currently releasing reports that cover the most recent time frame. The image has accurately reflected market trends over the past few months. The aforementioned illustration unequivocally demonstrates that since the start of September 2022, the net position for major players (the second indicator) has been improving. Around the same period, the value of the euro started to increase. Both the position of the European currency, which is typically unable to adjust downwards, and the net position of non-commercial traders are currently "bullish" and stay at very high levels. The fact that a relatively high value of the "net position" enables us to allow the upward trend to end quickly has already been brought to the traders' attention. The first indicator, which frequently occurs before the trend's conclusion and shows that the red and green lines are very far apart from one another, signals this. The European currency attempted to begin dropping, but so far it has only experienced an ordinary pullback. The number of buy contracts from the "non-commercial" group rose by 7.1 thousand during the most recent reporting week, while the number of short positions decreased by 6.9 thousand. The net situation hasn't changed much as a result. For non-commercial traders, there are 145 thousand more buy futures than sell contracts. A correction is still in the works, so even in the absence of COT reports, the pair should continue falling.
Analysis of significant events.
There are only two events that can be remembered in addition to the EU inflation report. The infamous report on German inflation, which saw the euro continue to rise despite expectations of a fall, and the report on unemployment in the EU, which came in at 6.6%. These reports, however, can hardly be considered significant. The European Union's core inflation indicator, which rose once again to 5.7%, was much more significant. It comes out that in March, the primary measure of inflation decreased by 1.6% while the base measure rose by 0.1%. In the context of the key rate, the fundamental indicator is more significant. The likelihood of the ECB strengthening its monetary policy continues to rise as it gets stronger. However, there is no consensus on this. It is also impossible to ignore the reality that overall inflation is declining. In general, even on Friday, the euro could increase, but the 50.0% Fibonacci level and the likelihood that the pair will remain flat on the 24-hour TF both worked.
Here is our trading strategy for the week of April 3–7.
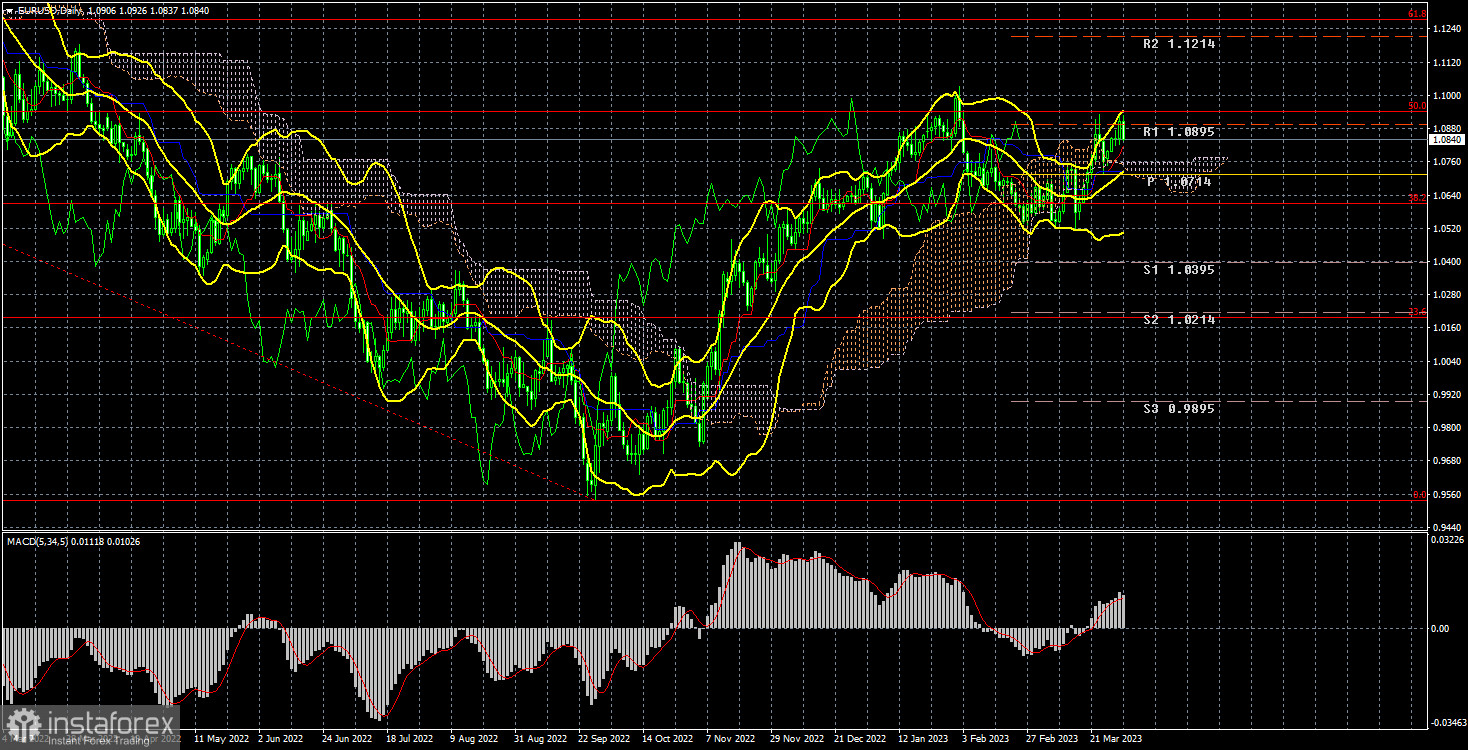
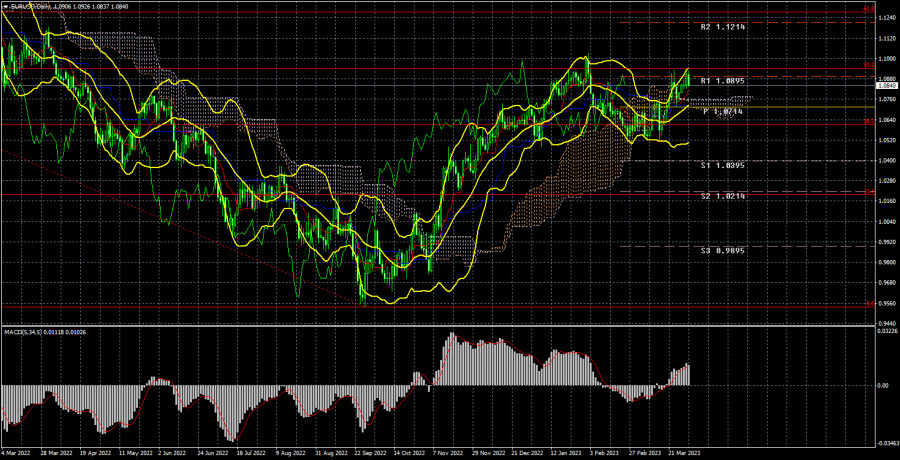
1) In the 24-hour timeframe, the pair has consolidated above the Ichimoku indicator's lines, but we cannot say that the upward trend has started up again. Although the market has recently been unable to determine what to do with the pair, we still think sales are expedient. We might witness a round of declining movement within the parameters of a "swing" or flat as early as next week. As a result, purchases can be contemplated either near the 1.0530 level or after surpassing the 50.0% Fibonacci level.
2) Given that the pair is close to its most recent local maximum, from which two rebounds have already taken place, we can now contemplate the beginning of sales of the euro/dollar pair. Now there is a good chance that the price will drop to 1.0530 or even less. The upward trend that has been actively forming over the previous six months has yet to result in any compelling reasons, in our opinion.
Explanations for the illustrations: Fibonacci levels, which serve as targets for the beginning of purchases or sales, and price levels of support and resistance (resistance/support). Take Profit levels may be close by.
Ichimoku indicators (standard settings), Bollinger Bands (standard settings), MACD (5, 34, 5).
The net position size of each trading group is represented by indicator 1 on the COT charts.
The net position amount for the "non-commercial" group is represented by indicator 2 on the COT charts.