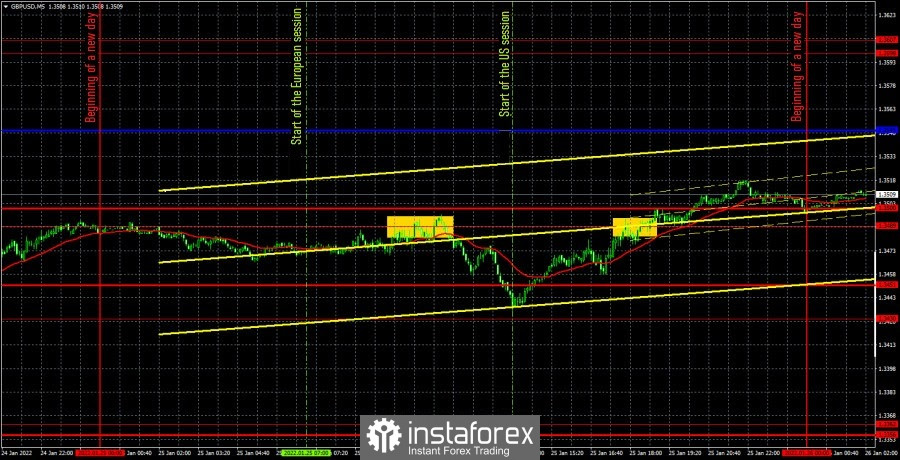
GBP/USD 5M

The GBP/USD pair traded much more calmly on Tuesday. It changed direction several times during the day, but in general, the movement itself was good enough to count on strong signals and profit. In principle, the whole movement of the day can be divided into two segments. After a rebound from the level of 1.3489 and after a formal rebound from the level of 1.3430. The second level at the end of the day was moved slightly up and it turns out that the price is now between them and a horizontal channel may even form here. However, the price is between these levels for only a day, which, of course, is not enough to establish a flat. Moreover, in recent months, the pound has been trading very actively and trendily. Thus, yesterday could have been just a day of rest for the British currency. It failed to rise in price during the day, but managed to avoid a new fall, which, we recall, is now quite logical both from a technical point of view and from the point of view of "foundation". Therefore, the British pound may resume to fall today, although it will largely depend on the outcome of the Federal Reserve meeting. As for trading signals, there were few of them on Tuesday. Only two, and the second one should hardly have been worked out. Let's analyze both. At first, the price rose to the extreme level of 1.3489 and bounced off it several times. Therefore, at this moment it was necessary to open short positions. Subsequently, the price began to fall quite heavily and went down about 40 points. On the way, it also overcame the support level of 1.3451 twice , so it was possible to take profits around the level of 1.3430 (unfortunately, there was no rebound), or after the price settled above the level of 1.3451. In any case, profit. The second signal was formed when the price returned to the level of 1.3489. However, it was already formed quite late, so it was better to skip it.
We recommend to familiarize yourself with:
Overview of the EUR/USD pair. January 26. First Fed meeting this year. What will be the results?
Overview of the GBP/USD pair. January 26. Boris Johnson keeps his name on the front pages of newspapers. The situation in Eastern Europe is heating up.
Forecast and trading signals for GBP/USD on January 26. Detailed analysis of the movement of the pair and trading transactions.
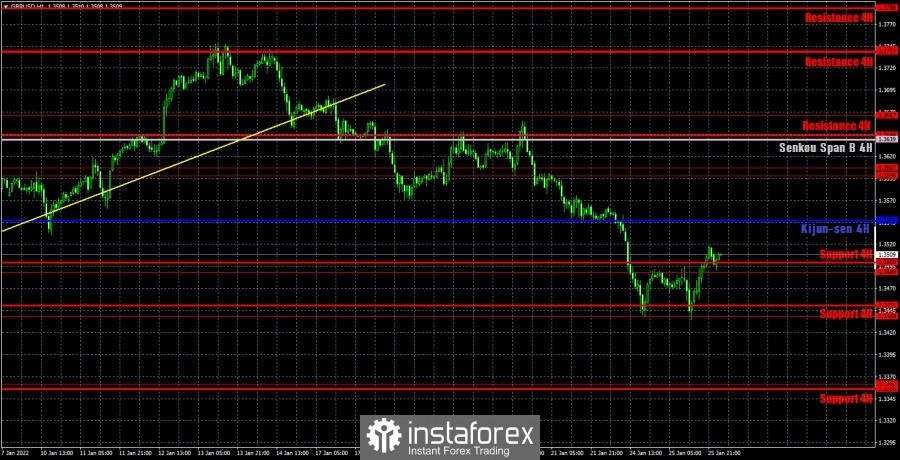
GBP/USD 1H

On the hourly timeframe, the pound/dollar pair as a whole continues a strong downward movement. The pound remains in the "danger zone" now, but at the same time traders have clearly taken a pause to find out what decisions will be made at the Fed meeting. We are only waiting for hawkish decisions, but will they satisfy bears and bulls of the US dollar? Quite possibly not. But at the same time, the results of the meeting will still be recognized as hawkish. In general, we believe that the outcome of Wednesday may be anything, but in general we expect a further fall in the pound/dollar pair. On January 26, we highlight the following important levels: 1.3362, 1.3439, 1.3489, 1.3598-1.3607. The Senkou Span B (1.3639) and Kijun-sen (1.3547) lines can also be signal sources. Signals can be "bounces" and "breakthroughts" of these levels and lines. It is recommended to set the Stop Loss level to breakeven when the price passes in the right direction by 20 points. The lines of the Ichimoku indicator can move during the day, which should be taken into account when determining trading signals. There are no fundamental and no macroeconomic events scheduled for Wednesday in the UK. There will be only a couple of secondary reports in America, and in the evening there will be a summing up of the Fed meeting with a press conference with Jerome Powell. All the attention on this event!
Explanations for the chart:
Support and Resistance Levels are the levels that serve as targets when buying or selling the pair. You can place Take Profit near these levels.
Kijun-sen and Senkou Span B lines are lines of the Ichimoku indicator transferred to the hourly timeframe from the 4-hour one.
Support and resistance areas are areas from which the price has repeatedly rebounded off.
Yellow lines are trend lines, trend channels and any other technical patterns.
Indicator 1 on the COT charts is the size of the net position of each category of traders.
Indicator 2 on the COT charts is the size of the net position for the non-commercial group.