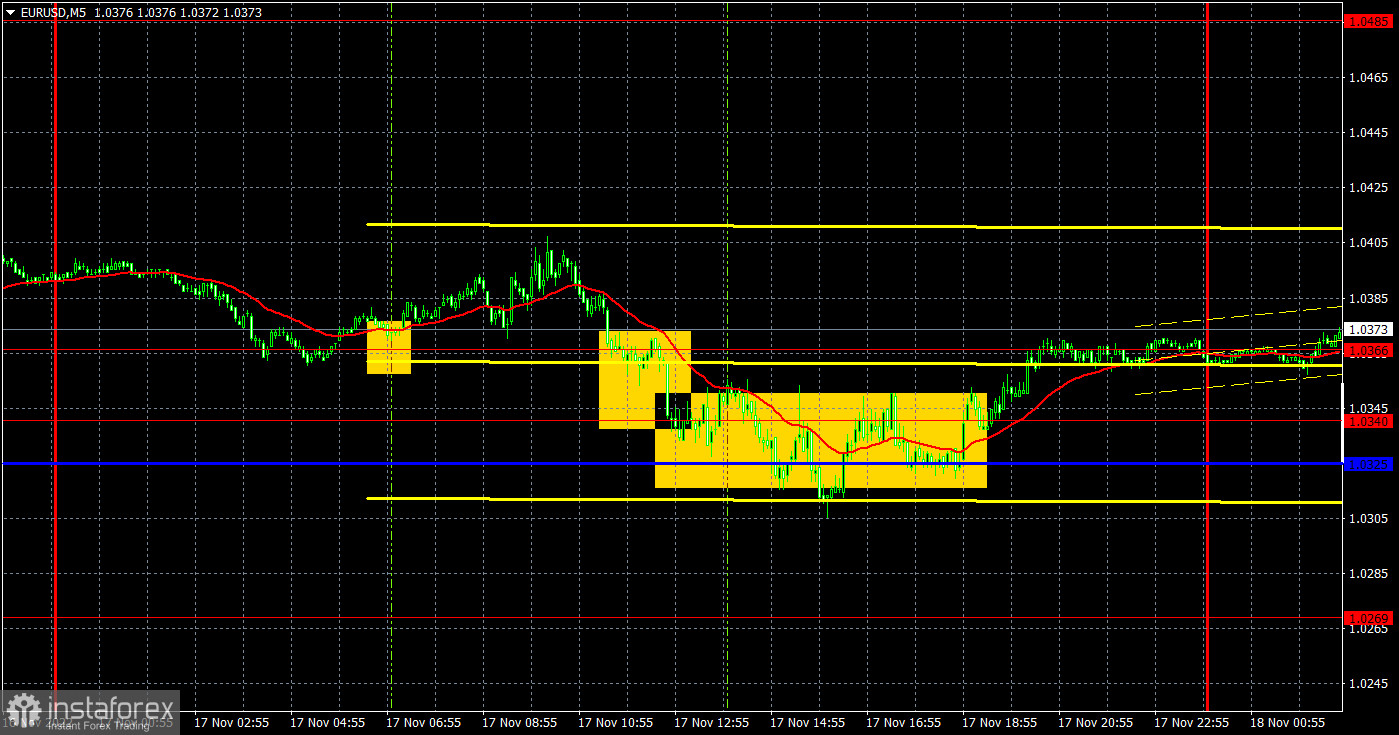
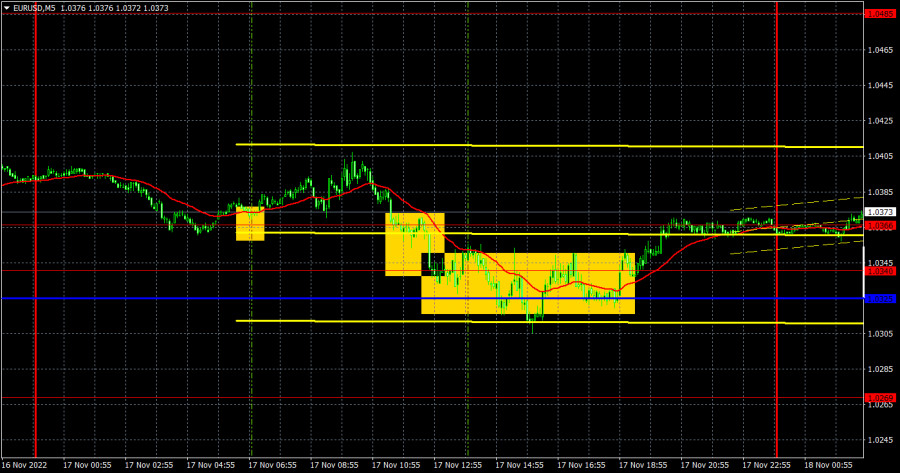
M5 chart of EUR/USD
On Thursday, the euro/dollar pair showed reluctant movement. In the first half of the day, a modest correction occurred. In the second half, the uptrend resumed. After the 2-year bear run, the euro is now on a winning streak. Notably, there have been no reasons for its current growth. Although we expected a noticeable correction this week, the pair's actual corrective movement was insignificant. In addition, this week, the pair trades under the influence of no macro releases or fundamental factors. Yesterday, the second inflation estimate for the eurozone was published. It came in at 10.6% in October, down by 0,1% from the previous estimate. In this light, the ECB is highly likely to raise the interest rate by 75 basis points at the next meeting. Of course, it is a positive factor for the euro although the currency soared enough in the past few weeks, according to the lower time frames. Nevertheless, the ascending trend line is still relevant and signals the continuation of the uptrend.
Speaking of the situation with technical signals, it was not the best. The first buy signal at around 1.0366 turned out to be a false one. After it was generated, the pair rose by just 30 pips, which was good because traders managed to place a Stop Loss order at the breakeven point. The price then moved down, settling below 1.0366, 1.0340, and the Kijun-sen line. All those lines and levels were close to each other and were seen as a support area. Therefore, it was possible to open short positions only below support. However, by that time, the pair had already gone down by 95 pips from the daily high. Therefore, that signal should have been ignored.
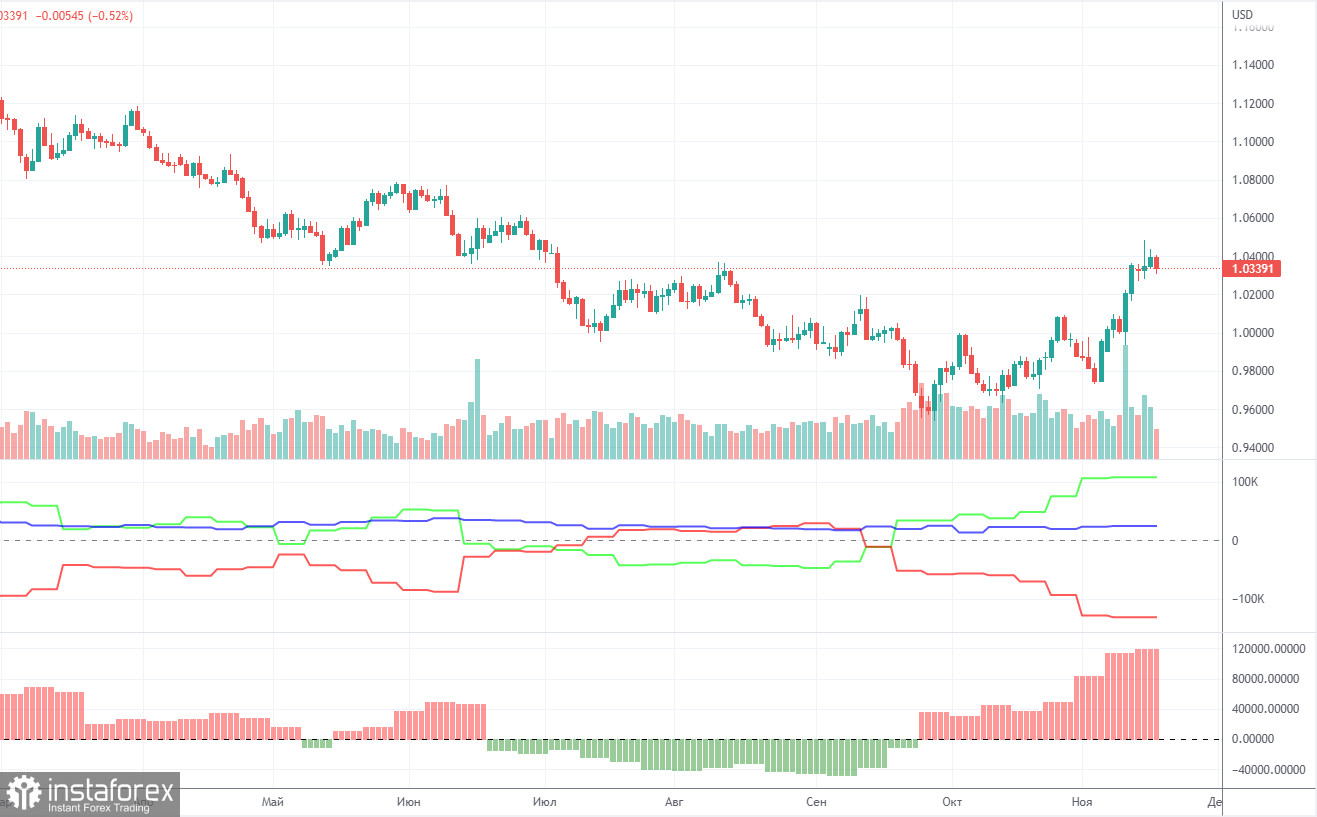
COT report:
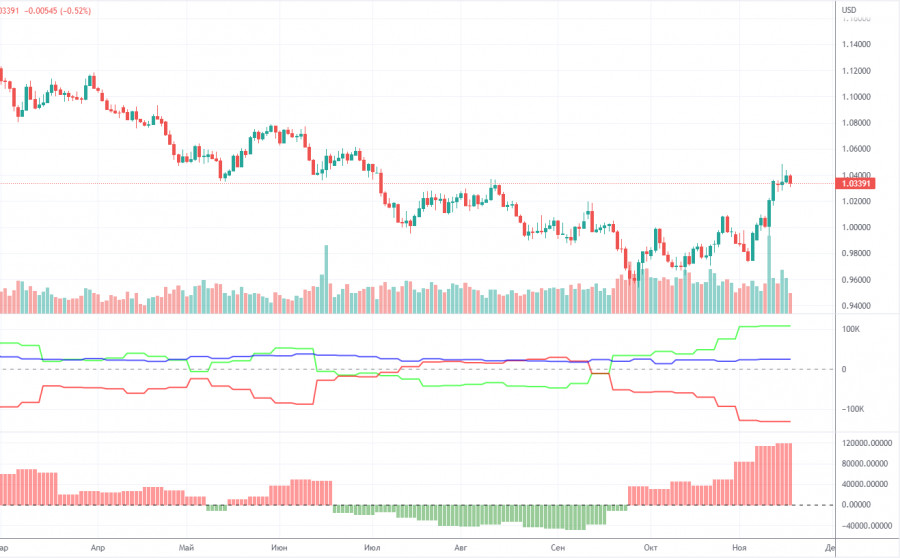
As for COT reports in 2022, they reflected bullish sentiment in the first six months of the year, while the euro was bearish. Then, they illustrated bearish sentiment for several months with the euro being also bearish. Currently, the net position of non-commercial traders is again bullish and increasing. Meanwhile, the euro has hardly retreated from its 20-year lows. This is due to the fact that demand for the greenback is high amid a difficult geopolitical situation in the world. Therefore, despite a rise in demand for the euro, buoyant demand for the dollar does not allow the euro to strengthen. During the reporting week, the number of long positions held by non-commercial traders dropped by 7,500 and that of short positions fell by 9,200. Consequently, the net position advanced by 1,700. The euro's recent growth is gradually coming in line with the figures illustrated in the COT report. Still, the greenback may resume growth under the influence of geopolitical factors or the lack of factors for further growth in the euro. The green and red lines of the first indicator moved far away from each other, which may indicate the end of the uptrend. The number of long positions exceeds that of short positions by 108,000. Therefore, the net position of non-commercial traders may continue to rise further, but without triggering a similar rise in the euro. When it comes to the total number of longs and shorts across all categories of traders, there are 24,000 more short positions (614,000 vs 590,000).
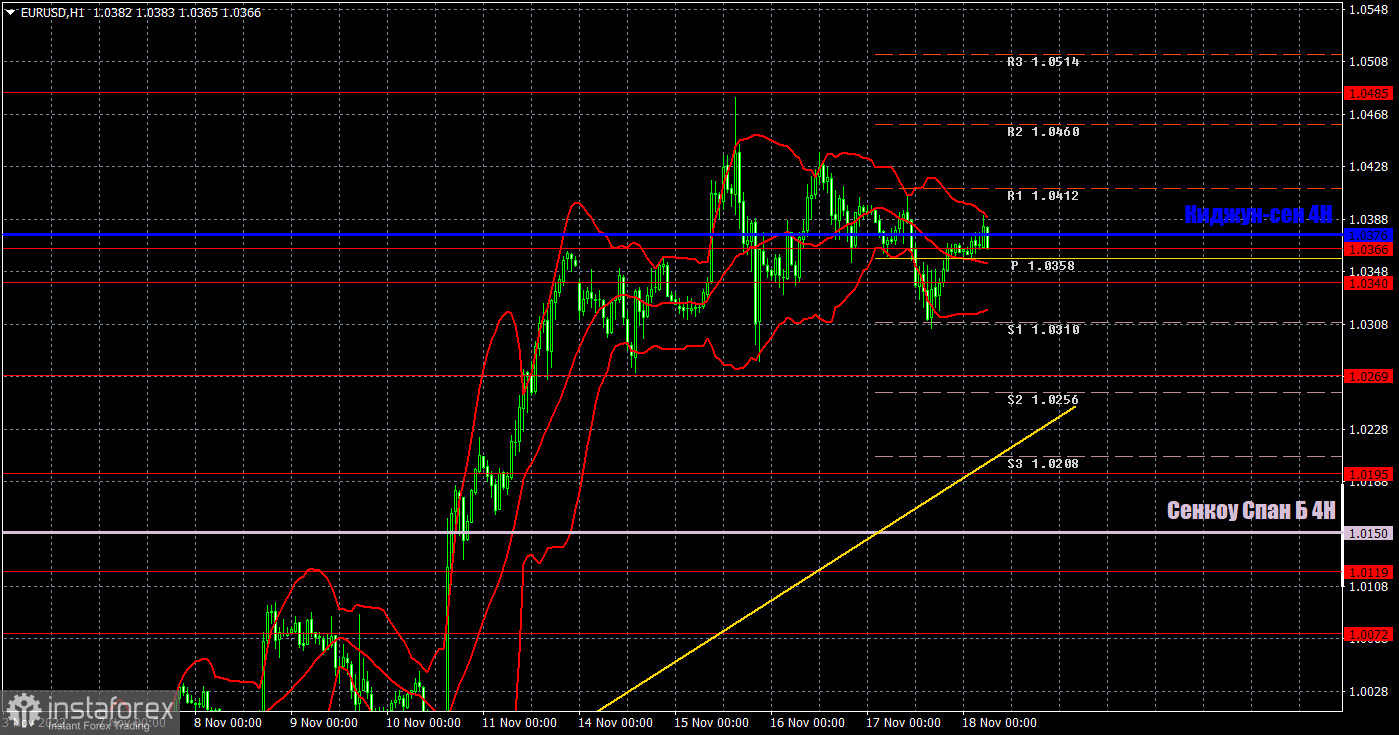
H1 chart of EUR/USD
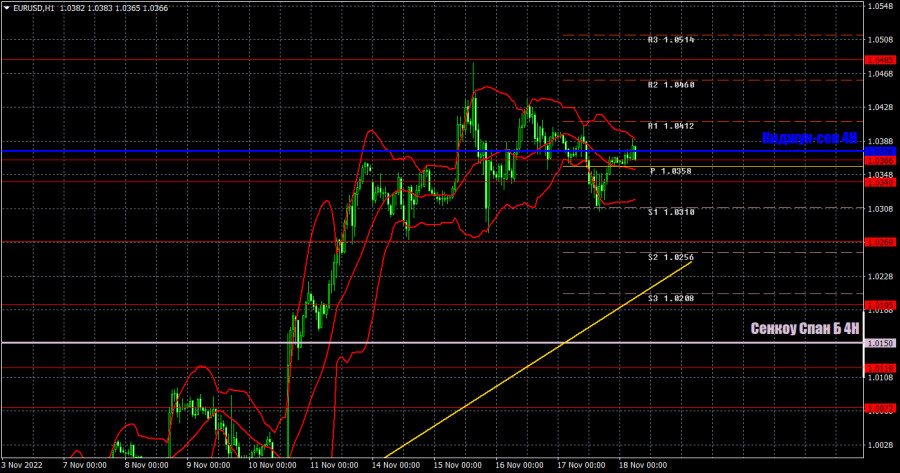
In the H1 time frame, a sluggish bearish correction is now taking place. However, we expect a stronger corrective movement. Nevertheless, a new downtrend may emerge only after a breakout through the trend line. On Thursday, trading levels are seen at 1.0072, 1.0119, 1.0195, 1.0269, 1.0340-1.0366, 1.0485, 1.0579, 1.0637, 1.0150 (Senkou Span B), and 1.0376 (Kijun-sen). Ichimoku indicator lines can move during the day, which should be taken into account when determining trading signals. There are also support and resistance although no signals are made near these levels. Signals can be generated whenever the price bounces or breaks through extreme levels and lines. Don't forget to place a stop-loss order at the breakeven point when the price passes 15 pips in the right direction. It can help you minimize losses when a signal turns out to be false. On November 18, the macroeconomic calendar is empty both in the eurozone and the United States. ECB President Lagarde's speech will be the only interesting event.
Indicators on charts:
Resistance/support - thick red lines, near which the trend may stop. They do not make trading signals.
The Kijun-sen and Senkou Span B lines are the Ichimoku indicator lines moved to the hourly timeframe from the 4-hour timeframe. They are also strong lines.
Extreme levels are thin red lines, from which the price used to bounce earlier. They can produce trading signals.
Yellow lines are trend lines, trend channels, and any other technical patterns.
Indicator 1 on the COT chart is the size of the net position of each trader category.
Indicator 2 on the COT chart is the size of the net position for the Non-commercial group of traders.