empty
 
 
01.12.2022 04:30 PM
EUR/USD. Analysis for December 1. The dollar has declined and is threatening to break the wave pattern again.

This image is no longer relevant

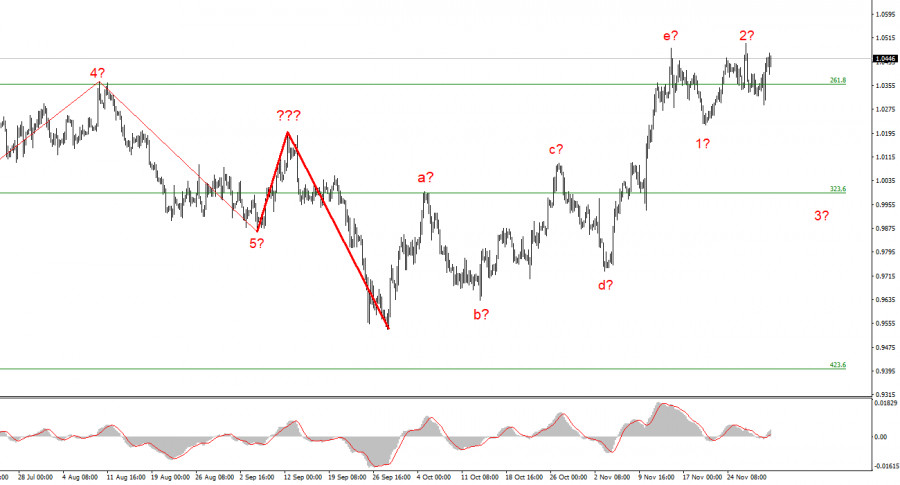
Although it still looks very convincing, the wave marking on the 4-hour chart for the euro/dollar instrument needs to be adjusted. The upward portion of the trend has corrected itself. We have obtained a complex correction structure of a-b-c-d-e waves. The peak of wave e exceeds the peak of wave C, so if the wave markings are accurate, construction on this structure may be nearly finished or already finished. In this instance, it is anticipated that we will construct at least three waves downward, but if the most recent phase of the trend is corrective, the subsequent phase will probably be impulsive. Therefore, I am preparing for a new, significant decline in the instrument. The market will be ready to sell when a new attempt to breach the 1.0359 level, which corresponds to 261.8% Fibonacci, is successful. However, the retraction of quotes from the reached lows this week suggests that the entire wave e may end up longer and that the instrument's most recent decline is not the first wave of a new descending section. However, the alleged wave 2 or b might still exist because it only punctured the wave e's peak. Because there isn't an increase in demand for US currency, the wave pattern is generally starting to become muddled.

Powell received no attention from the market at all.

The euro/dollar instrument increased by 60 and 70 basis points on Thursday and yesterday, respectively. Thus, a more complex and extended form of wave e is becoming more and more likely. Unfortunately, given the current course of events, it is possible to repeat this process multiple times for the entire upward section of the trend. Over the past two years, the downward section has repeatedly taken on a longer form than was anticipated, and upward corrective waves have become extremely rare. Things are going in the opposite direction right now. Demand for the dollar may decline even on days when it is not in danger.

There was no trouble yesterday. Inflation in Europe dropped to 10%, while third-quarter GDP growth in the United States was 2.9%. Excellent conditions for the US currency to increase in value. Instead, we noticed a new rise in quotes because the market perceived Fed President Jerome Powell's speech as slightly more "dovish" than before. This occurred in the evening. Since the main theses have stayed the same for several weeks or months, I don't think so either. Other FOMC members also express them in addition to Powell. However, the market was once more selling and wanted to. It's getting more difficult to continue to believe that the anticipated downward wave or set of waves will be built. Only the manufacturing sector business activity index has been made public in the European Union, and an equivalent index has yet to be made public in America. The growth of the instrument can continue if tomorrow's payrolls are within market expectations by a significant margin.

This image is no longer relevant

Conclusions in general

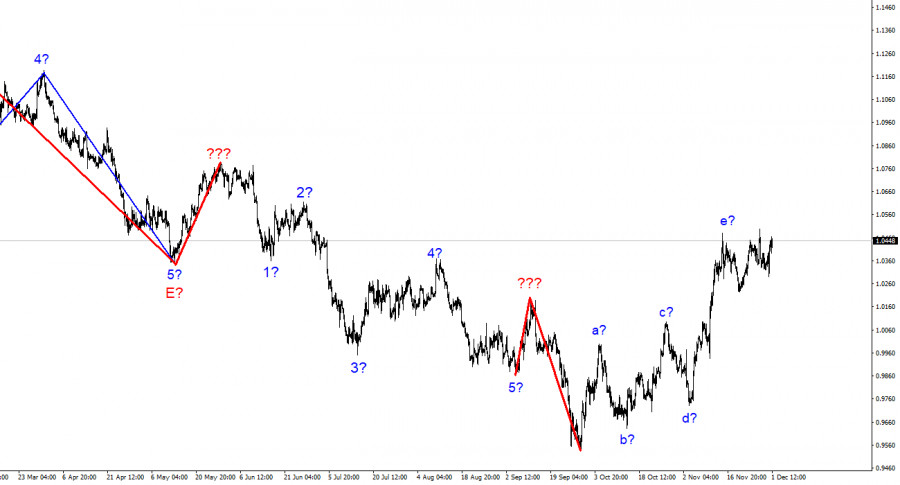
The upward trend section's construction is complete and has increased complexity to five waves (or is nearing completion). As a result, I suggest making sales with targets close to the estimated 0.9994 level, or 323.6% Fibonacci. The likelihood of this scenario occurring is increasing daily. The upward portion of the trend may become more extended and complicated.

The wave marking of the descending trend segment becomes more intricate and lengthens at the higher wave scale. The a-b-c-d-e structure is most likely represented by the five upward waves we observed. After the construction of this section is finished, work on a downward trend section may resume.

Chin Zhao,
Especialista em análise na InstaForex
© 2007-2023
EURUSD
Euro vs US Dollar
Select timeframe
5
min
15
min
30
min
1
hour
4
hours
1
day
1
week
Start trade
Start trade
  • Grand Choice
    Contest by
    InstaForex
    InstaForex always strives to help you
    fulfill your biggest dreams.
    PARTICIPE DO CONCURSO
  • Chancy Deposit
    Deposite US $ 3.000 em sua conta e receba $8000 mais!
    Em Março nós sorteamos $8000 na campanha Chancy Deposit!
    Tenha a chance de ganhar, depositando $3,000 em sua conta de negociação. Após cumprir essa condição, você se torna um participante da campanha.
    PARTICIPE DO CONCURSO
  • Trade Wise, Win Device
    Abasteça a sua conta com pelo menos $500, inscreva-se no concurso e tenha a chance de ganhar dispositivos móveis.
    PARTICIPE DO CONCURSO
  • Bônus de 100%
    Sua oportunidade única de receber um bônus de 100% em seu depósito
    RECEBA O BÔNUS
  • Bônus de 55%
    Solicite um bônus de 55% em cada depósito
    RECEBA O BÔNUS
  • Bônus de 30%
    Receba um bônus de 30% toda vez que você fizer um depósito em sua conta
    RECEBA O BÔNUS

Recommended Stories

Análise de onda de Elliott de EUR/USD para 23 de março de 2023.

O EUR/USD quebrou claramente acima da resistência em 1,0804 para confirmar que a onda 4 foi concluída com o teste de 1,0516 e uma nova alta impulsiva na onda

Torben Melsted 13:18 2023-03-23 UTC+2

GBP/USD. Análise para 22 de março. A inflação britânica está subindo novamente.

A análise das ondas para o par libra/dólar agora parece desafiadora, mas não exige nenhum esclarecimento. Os padrões de onda do euro e da libra diferem um pouco, mas ambos

Chin Zhao 20:46 2023-03-22 UTC+2

GBP/USD. Análise de 21 de março de 2023.

A análise das ondas para o par libra/dólar agora parece desafiadora, mas não exige nenhum esclarecimento. Os padrões de onda do euro e da libra diferem um pouco, mas ambos

Chin Zhao 20:09 2023-03-21 UTC+2

Análise da onda Elliott do EUR/JPY para 20 de março de 2023.

O EUR/JPY finalmente quebrou abaixo da linha de suporte da bandeira e deve continuar mais baixo em direção ao nosso alvo de longo prazo perto de 133,55, com o primeiro

Torben Melsted 14:35 2023-03-20 UTC+2

Análise de onda de Elliott do GBP/JPY para 16 de março de 2023.

Esperamos que o GBP/JPY continue a pressão negativa e uma quebra abaixo do apoio perto de 159,20 para um declínio em direção à meta de 145,76. A curto prazo, vemos

Torben Melsted 20:00 2023-03-16 UTC+2

Análise de onda de Elliott do EUR/JPY para 16 de março de 2023.

O EUR/JPY está testando a linha de suporte da bandeira e provavelmente quebrará abaixo desta linha de suporte em breve para confirmar a próxima parte da correção descendente em direção

Torben Melsted 14:24 2023-03-16 UTC+2

Análise da onda Elliott do NZD/USD para 15 de março de 2023.

O NZD/USD está pronto para o próximo avanço impulsivo em direção a pelo menos 0,7706 e possivelmente até mais perto de 0,8214. Nossa melhor interpretação do rally desde a baixa

Torben Melsted 14:26 2023-03-15 UTC+2

Análise de onda Elliott do GBP/JPY para 10 de março de 2023.

Uma quebra abaixo do suporte menor em 161,19 confirmará que a onda iv foi concluída e a onda v inferior a 145,76 está em movimento. A queda para nosso alvo

Torben Melsted 15:07 2023-03-10 UTC+2

Análise da onda Elliott do EUR/JPY para 10 de março de 2023.

O EUR/JPY está corrigindo o rally de 114,42 para 148,40 e provavelmente acabou de concluir a Onda X. A expectativa é que o instrumento inicie uma nova correção em zig-zag

Torben Melsted 15:05 2023-03-10 UTC+2

Análise da onda Elliott do USD/JPY para 9 de março de 2023.

O par USD/JPY testou o alvo corretivo de 38,2% em 138,17, que também está perto do pico da onda iv de A, que chegou a 138,18. Isto é suficiente para

Torben Melsted 19:36 2023-03-09 UTC+2
Não pode falar agora?
Faça sua pergunta no chat.