


was formed on 19.08 at 18:00:27 (UTC+0)
signal strength 1 of 5
signal strength 1 of 5
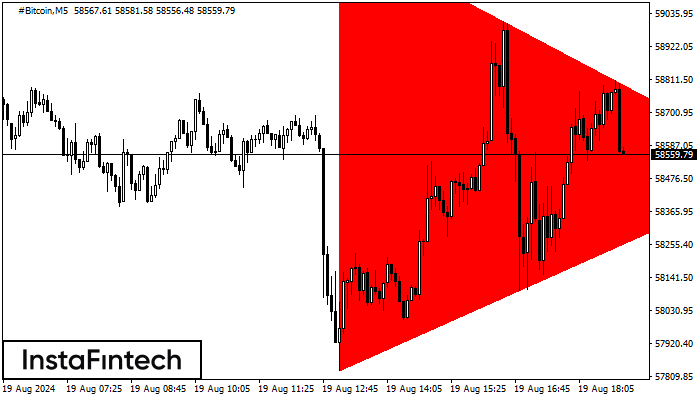
The Bearish Symmetrical Triangle pattern has formed on the #Bitcoin M5 chart. Its lower boundary passes through 57829.31/58499.38, while its upper boundary passes through 59301.90/58499.38. The pattern width is 147259 points. The Bearish Symmetrical Triangle indicates a likely continuation of the downtrend. If #Bitcoin breaks below the lower boundary, the price could move toward 58499.23.
The M5 and M15 time frames may generate more false entry signals.
Figure
Instrument
Timeframe
Trend
Signal Strength


