The pound/dollar currency pair continues to surprise and at the same time alarm with extremely weak volatility, what is going on and whether we have entered into the same long-playing sideways movement – we will analyze this question in our article.
From the point of view of technical analysis (TA), we have a literal stagnation, where the quote went to the recovery phase after conditional testing of the psychological level of 1.3000, but faced with low trading interest, which eventually resulted in a multidirectional and low-liquid movement, ending the day with a flat candle of the "Doji" type. So, at the moment, walking between the control levels of 1.2770/1.3000 carries not only a broad platform for oscillation but also stages of indecision, characteristic ambiguity and a decline in interest expressed in volatility. Just one volatility item from the list above daily signals a sluggish and indecisive market, just take a look at the indicators: 58 – 65 – 97 – 62 – 75 – 45 – 67 – 58 points at an average daily rate of 115 points. Now, we understand what kind of "progress" the interest of market participants is on, and this is not the end since as long as the framework of 1.2770/1.3000 remains on the market, there is nothing worth waiting for.
Examining every hour of the last day, we see that the movement is conventionally horizontal, but it also had its bursts. For example, the period 14:00-17:00 (trading terminal time) was expressed in a downward surge in price, with a volatility of about 50 points. After that, the horizontal movement with a low oscillation of 20 points resumed, ending the day with a Doji candle.
As discussed in the previous review, traders moved to sell positions at the time of the passage of the value of 1.2925, after which transactions were conducted. The projected coordinates were in the order of 1.2860 – 1.2800 – 1.2770, where the first value has already been reached by the price.
Looking at the trading chart in general terms (daily period), we see that at the peak of the impulse move, the quote moved to the stage of slowing down, just expressed in the swag between the levels of 1.2770/1.3000. In terms of considering the existing fluctuation in the form of a flat, we see that the current finding of the price coincides with the value of 50% of the level (1.2885) of the corridor of 1.2770/1.3000.
The news background of the day was the UK PMI business activity index, which recorded an increase from 49.5 to 50.0. In the United States, the ISM non-manufacturing PMI was released, where growth was stronger than previously forecast from 55.2 to 57.0. Finally, there was data on open JOLTS US vacancies, where they initially predicted growth, but in the end, the previous data was revised 7.051M – 7.301M, and the final data came out with a decline of 7.024M.
There was no market reaction to the statistics.
The information background found a new topic for discussion, and it became the election race, pouring streams of criticism into the light. So, the British Prime Minister Boris Johnson at the start of his election campaign compared the leader of the opposition Labor Party, Jeremy Corbin, with the head of the USSR Joseph Stalin.
"The tragedy of the modern Labor Party under Jeremy Corbyn lies in the fact that they internally hate the desire for profit and will so uncontrollably raise taxes that they will destroy the very foundation of the country's prosperity. They pretend that their hatred is directed only at certain billionaires, and they point fingers at people with pleasure and vengeance, unprecedented since Stalin pursued his fists, "Johnson wrote in a column in The Daily Telegraph.
Corbyn did not respond to the Prime Minister's outbursts, and his goal is now a little different, to turn the public against the current government – "Johnson intends to build a deregulated American model of economic management in the country after Britain leaves the European Union."
In turn, Boris Johnson actively maintains contact with the West, where during a telephone conversation with US President Donald Trump discussed issues of cooperation after Brexit.
"The two leaders reaffirmed their intention to strengthen special relations through a well-developed bilateral free trade agreement after the United Kingdom withdrew from the European Union. The president also emphasized the need for NATO allies to fully finance their defense," the White House's disclosed document says.
Johnson also urged Trump to abolish duties on goods, including Scotch whiskey and ahead of the US decision on additional duties, he urged him not to impose duties on car imports.
Finally, there was interesting information from the former head of the European Commission Jean-Claude Juncker, who in good conscience said that during the campaign for Brexit, there were many lies, including from Boris Johnson.
"The European Commission is even less popular in Britain than on the continent. I decided not to interfere. Looking at it today, I think it was a big mistake. So many lies have been said, including by current Prime Minister Boris Johnson, that there had to be a voice to confront them," Jean-Claude Juncker said in an interview with Spiegel.
Today, in terms of the economic calendar, we do not have noteworthy statistics on Britain and the United States.
Further development
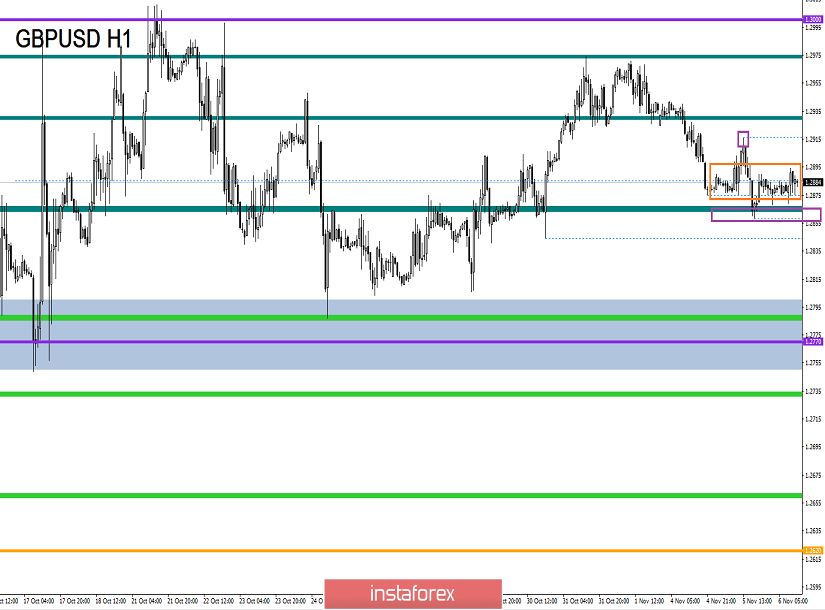
Analyzing the current trading chart, we see a calm and smooth surface, expressed almost in a smooth horizontal movement, and with such low volatility, you forget that you are looking at the GBPUSD chart. Ambiguity and wariness are gaining new scales, where the movement is conducted along 50% of the value (1.2885) of the corridor of 1.2770/1.3000. If we analyze the values relative to the current cluster, we have such modest boundaries as 1.2875/1.2895.
Detailing the minute-by-minute movement, we see in the structure of the cluster a very large number of candles "Doji", which once again indicates a characteristic ambiguity.
In turn, speculators are not asleep, as such stops are harbingers of high price jumps. It is worth considering that at this time, short positions are still held by traders, but at the same time, alternative positions are considered, in case there is a local surge in the opposite direction.
It is possible to assume that in the event of a breakdown of the level of 1.2855, the downward movement will resume and traders will reach the limits of the range level of 1.2770 (1.2750/1.2770/1.2800). An alternative scenario is considered in terms of local price spikes. Where, in the event of a departure above the existing accumulation of 1.2895, we will be temporarily sent to 1.2915, where it is worth watching the behavior of market participants with a continuing upward mood.
Based on the above information, we derive trading recommendations:
- Buy positions are considered in terms of splashes in case of fixing higher than 1.2895, with the first point of 1.2915. After that, the analysis of behavior with a possible top-up.
- Sell positions are held towards the range level of 1.2770 (1.2750/1.2770/1.2800). If we have no trades, it is possible to consider the entry point as a value of 1.2855.
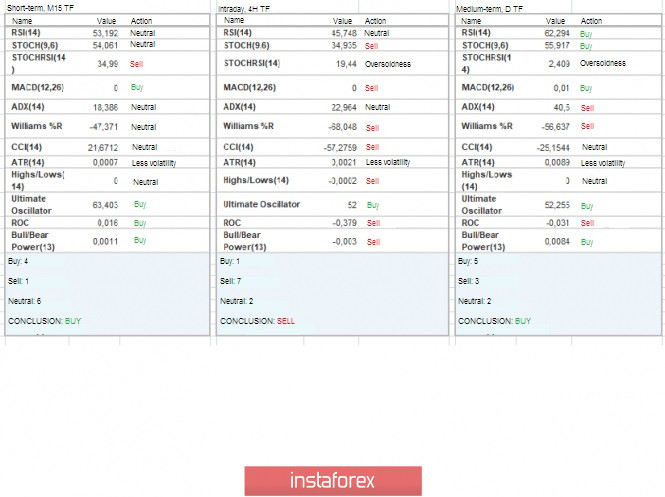
Indicator analysis
Analyzing different sector timeframes (TF), we see that the indicators continue to show a multidirectional nature. Short-term intervals fluctuate in the available accumulation, signaling a purchase at this hour. Intraday intervals work during the recovery phase, signaling sales. The medium-term outlook is fixated on an earlier inertial course, signaling purchases.
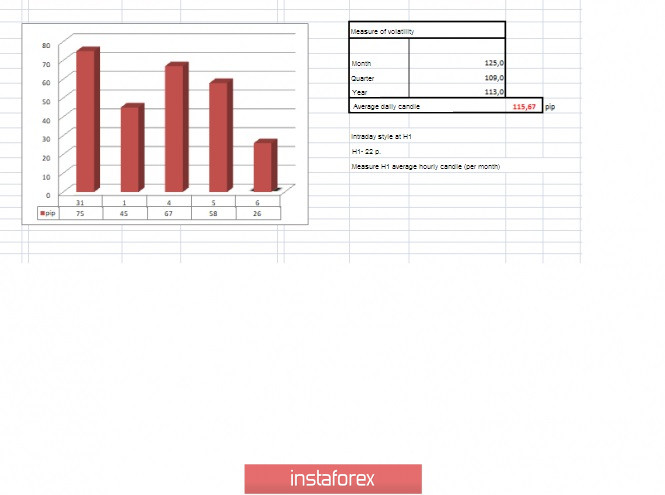
Volatility per week / Measurement of volatility: Month; Quarter; Year.
Measurement of volatility reflects the average daily fluctuation, calculated for the Month / Quarter / Year.
(November 6 was built taking into account the time of publication of the article)
The volatility of the current time is 26 points, which is extremely low for this period. Such strong slowdowns often lead to price spikes and, as a fact, to increased volatility. Thus, we carefully monitor the market, so as not to miss this most long-awaited surge.
Key levels
Resistance zones: 1.3000; 1.3170**; 1.3300**.
Support zones: 1.2770**; 1.2700*; 1.2620; 1.2580*; 1.2500**; 1.2350**; 1.2205(+/-10p.)*; 1.2150**; 1.2000***; 1.1700; 1.1475**.
* Periodic level
** Range level
*** The article is based on the principle of conducting transactions, with daily adjustments.