From the point of view of a comprehensive technical analysis, we see that after the quotes reached 1.2904, a slowdown occurred, where several factors layered on top of each other. So, the first priority is the decrease in trading volumes in connection with the celebration of Christmas, where there was an early closing last December 24, and the markets were no longer working on December 25. The second factor reflects local overselling, where, for a week and a half there was a decline in quotes resulting in an improper number of 600 points. So it is understood that the market is reluctant to stand still, having not even a correction, but a kind of stagnation / rollback.
In terms of developmental theories, the topic of amplitude 1.2885 / 1.3000 is actively being crammed now, meaning to say, the maximum values that market participants will adhere to until the end of the year. In some ways, the logic of the judgment is clear, trading volumes will be limited, and the information and news background will be quite quiet, but if speculators who try to break the system use the thin market, this is the following theory. So, on such modest volumes and narrow frames, there are not so many trading forces to break borders and draw momentum.
The second theory interested me, I decided to conduct my own research. So, raising historical data from 2000 to 2018, the last days of the past year were taken, where, to my great surprise, the truth was volatility.
12/24/18 - 12/31/18 = 91 points [daily average candle]
12/26/17 - 12/31/17 = 69 p.
12/26/16 - 12/31/16 = 76 p.
12/28/15 - 12/31/15 = 88 p.
12/26/14 - 12/31/14 = 62 p.
12/26/13 - 12/31/13 = 103 p.
12/26/12 - 12/31/12 = 107 p.
12/26/11 - 12/31/11 = 133 p.
12/27/10 - 12/31/10 = 167 p.
12/28/09 - 12/31/09 = 181 p.
12/26/08 - 12/31/08 = 272 p.
12/26/07 - 12/31/07 = 145 p.
12/26/06 - 12/29/06 = 103 p.
12/26/05 - 12/30/05 = 143 p.
12/27/04 - 12/31/04 = 183 p.
12/26/03 - 12/31/03 = 104 p.
12/26/02 - 12/31/02 = 79 p.
12/26/01 - 12/31/01 = 116 p.
12/26/00 - 12/29/00 = 119 p.
It turns out that the absence of leading players is not a remedy, but the surviving traders have something to work on. In this study, it is worth adjusting for the time, that the volatility has decreased over the years. For example, in the calculation from 2000 to 2009 we had an average daily candle of 153 points, and in the period 2010 to 2018, there is only 119 points.
Going back, parsing every minute on December 24, we see that although the movement was weak, it was in the rollback phase which may have been a reflection of partial fixations from short positions on the eve of the weekend which is on December 25.
As discussed in the previous review, many traders are still supporters of the downward movement, although the prospect was in the region of 1.2885-1.2770 with respect to the given coordinates.
Looking at the trading chart in general terms which is the daily period, we see that December satisfied the interest of many with its spire of more than 600 points, and the most striking thing is that right now we are in the area of the month's opening point.
The news background of the past two days was absent due to the celebration of Christmas.
In terms of informational background, we have a sparse stream of news, mainly related to the legal aspects of Brexit. So, the final "third reading" of the bill on Britain's exit from the EU will take place next year, and with full confidence, we can say that it will be approved by the parliament. At the same time, discussions are underway on subsequent negotiations regarding issues of further relations between the parties. It is expected that negotiations will now take place not only in Brussels but also in London. On the EU side, the negotiator will remain in the person of Michel Barnier, while the name of the minister is not yet known on the British side.
Today, in terms of the economic calendar, we only have data on applications for unemployment benefits in the United States, where they are expected to reduce a Primary of 10 thousand and a Repeated of 31 thousand.
Do not forget that Europe and Britain continue to relax, and only the United States went to work.
Further development
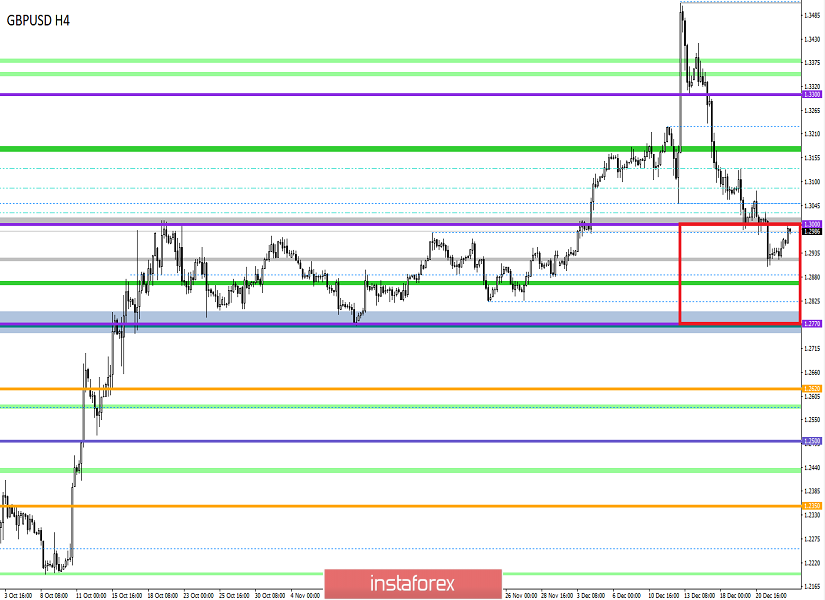
Analyzing the current trading chart, we see that the quotes has again returned to the area of the psychological level of 1.3000, where it felt a kind of resistance was slowing down the corrective move. In fact, we continue to concentrate within the range of 1.2885 / 1.3000, as described above.
By detailing the time interval that we have, we see that in the Pacific and Asian trading sessions, a local jump of 03:10 - 03:30 [time at the trading terminal] was noticed, which just returned the quotes to the psychological level of 1.3000. With almost complete certainty, we can say that it carried, leaping, speculative interest in just a narrow market.
In turn, the main traders continue to rest, being in a moderate proportion of short positions. Speculators try to take advantage of the outgoing year to the last, referring to the theory of a narrow market, which was written about at the beginning of the article.
Having a general picture of actions, it is possible to assume that the 1.2885 / 1.3000 borders will continue to play the role of a restrictive framework, where I do not exclude a kind of local breakdown, possibly shadows, but the concentration will remain within the same boundaries.
Based on the above information, we derive the following trading recommendations:
- We consider purchase positions in the case of a clear price-fixing higher than 1.3000.
- Sales positions are already being conducted towards 1.2885-1.2770, with a conservative trading volume.
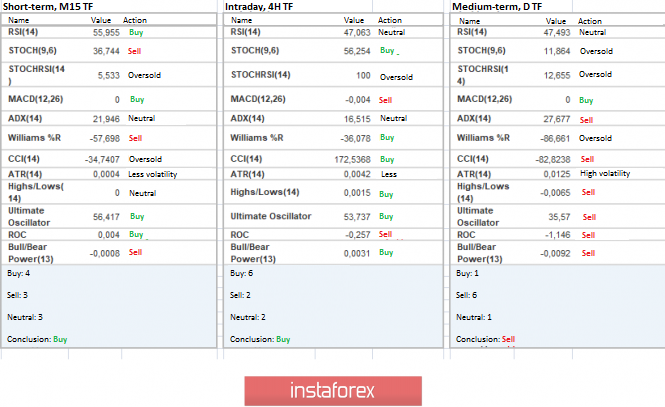
Indicator analysis
Analyzing a different sector of timeframes (TF), we see that the indicators are reluctant to take the upward side relative to the minute and hour periods. Medium-term segments still retain a downward interest.
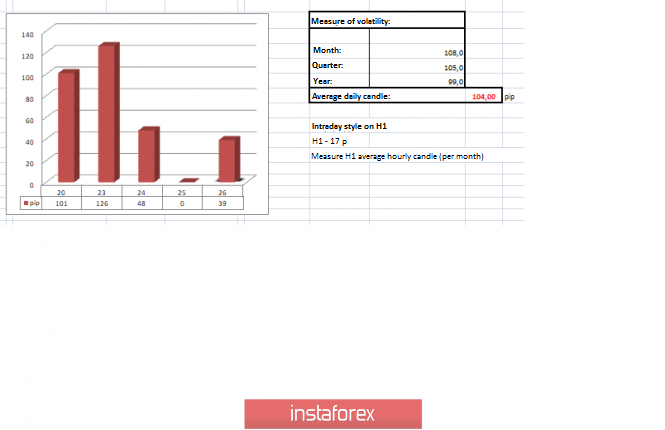
Volatility per week / Measurement of volatility: Month; Quarter Year
Measurement of volatility reflects the average daily fluctuation, calculated for the Month / Quarter / Year.
(December 26 was built taking into account the time of publication of the article)
The current time volatility is 39 points, which is a low value. It is likely to assume that volatility may be kept low due to the ongoing holidays unless the theory of the thin market works.
Key levels
Resistance Zones: 1.3000; 1.3180 **; 1.3300 **; 1.3600; 1.3850; 1.4000 ***; 1.4350 **.
Support Areas: 1.2885 *; 1.2770 **; 1.2700 *; 1.2620; 1.2580 *; 1.2500 **; 1.2350 **; 1.2205 (+/- 10p.) *; 1.2150 **; 1,2000 ***; 1.1700; 1.1475 **.
* Periodic level
** Range Level
*** Psychological level
**** The article is built on the principle of conducting a transaction, with daily adjustment