From a complex analysis point of view, we see an inertial move that with surgical accuracy the quotes returned to the range of 1.1080, after which a steady pattern played and a rebound. In fact, we see a kind of reflection of the period 12/20/19 - 12/26/19, where, similar to our case, there was an inertial course and a deceleration with the fulcrum. The difference between the patterns is that for the current situation, we did not have a restrained downward interest, and the acceleration of volatility and a sharp reverse move were associated with a seasonal factor. Thus, there is still a chance of a further decline, albeit after a local stagnation-rollback. Looking at the market in general terms, we see that the two currency pairs [EURUSD & GBPUSD] have a control convergence, each with its own key level, showing a kind of synchronism which suggests a general move. The correlation in this particular case is quite high between trading instruments, and if we refer to the Zigzag-shaped theory and acceleration, there is a chance of a synchronous move between the EURUSD & GBPUSD in terms of breakdown.
In terms of volatility, we have a sharp slowdown, which was last observed eight trading days ago. That is, the slowdown, expressed in accumulation along the control level, can accumulate speculative positions and having future acceleration.
Analyzing the past minute by minute, we see an attempt to break through the control value of 1.1080, but as a result we got a small amplitude directed horizontally. Even with such a small amplitude, the structure of the candles on the minute chart [M15] has a small percentage of Doji candles.
As discussed in the previous review, traders who have short positions even from the first and second inertial moves switched to full fixation of trade transactions as soon as the price began to come close to the range of 1.1080. These actions were justified in connection with the risk of a rebound.
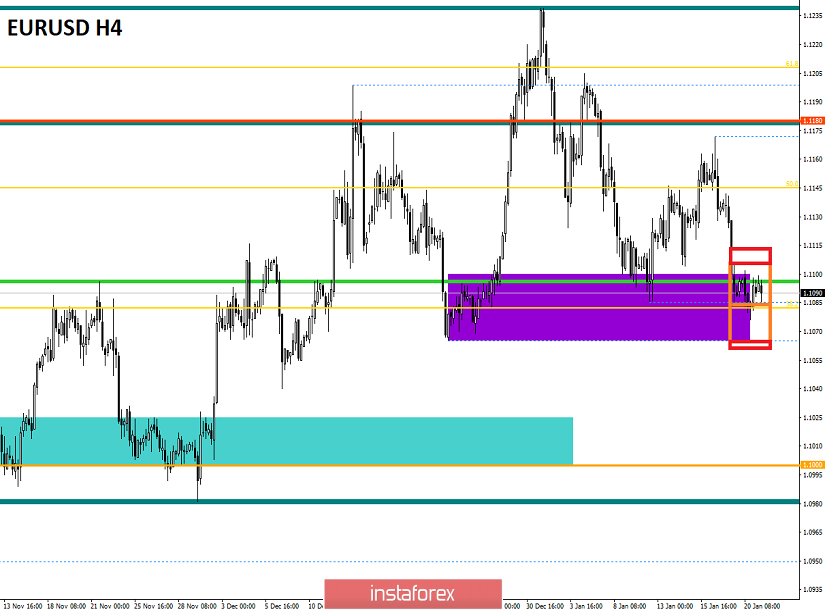
Considering the trading chart in general terms [the daily period], we see an oblong correction of just under four months, where the existing pivot point [1,1080] is the first stage of recovery.
The news background yesterday did not have statistics in it, while in the United States there was a day off in connection with the celebration of Martin Luther King Day.
In terms of informational background, we have a kind of respite on both fronts, where US-Chinese trade relations are preparing for negotiations on the second phase, the Brexit process is preparing for an intriguing and quick transition. Soon, the information background will sparkle with new colors and will have a special impact on the market, there is not much time left before the start.
Today, in terms of the economic calendar, we again have a blank sheet in terms of statistics for Europe and the United States.
Further development
Analyzing the current trading chart, we see the concentration of prices in the area of the same range of 1.1080, conditionally having a sideways move. In fact, the quotes froze, which signals a continuation of a downward interest, otherwise, the alignment in terms of rebound developed much more extensively.
In terms of the emotional component of the market, we see restraint, which is expressed in accumulation, and this is a fine line, because with the slightest change in trading forces inside the accumulation speculative positions will stir up.
By detailing the minutely available trading day, we see that from the beginning of the trading day the amplitude is less than 15 points, and the movement is strictly horizontal.
In turn, traders do not have open trading operations, now a thorough analysis and monitoring of price-fixing points are being carried out since the working method can be "Breakout / Rebound".
It is likely to assume that the current range level of 1.1080 will continue to exert pressure on the quotes, which will result in lateral movement and a local surge in the activity. The trading strategy remains the same as the last time, Breakout / Bounce, where the rebound is precisely the local long positions, and the main deals are considered already in the case of a downward movement due to the restoration of the initial trend.
Based on the above information, we derive trading recommendations as follows:
- Buy positions will be considered in case of price-fixing higher than 1.1110.
- Sell positions will be considered if the price is fixed lower than 1.1060.
Indicator analysis
Analyzing a different sector of timeframes (TF), we see that the rollback / stagnation did not change the mood of technical tools, which still signal a downward movement. It is worth considering that in the case of tightening of low-amplitude lateral movement, indicators of indicators can change to neutral interest.
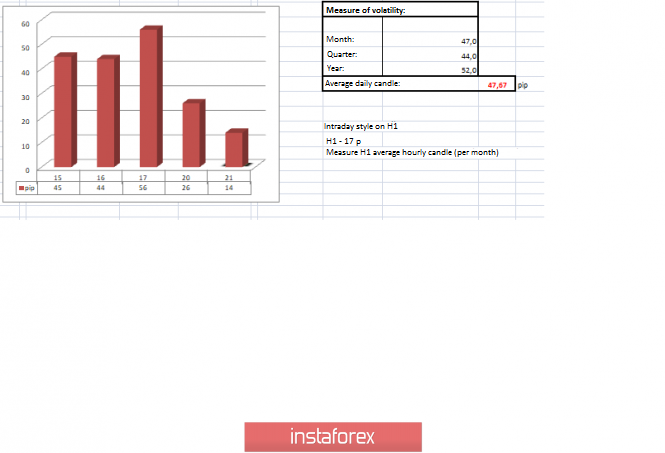
Volatility per week / Measurement of volatility: Month; Quarter Year
Measurement of volatility reflects the average daily fluctuation, calculated for the Month / Quarter / Year.
(January 21 was built taking into account the time of publication of the article)
The current time volatility is 14 points, which reflects an extremely low indicator. It is likely to assume that the slowdown will not last as long as many assume, and soon we will see acceleration.
Key levels
Resistance zones: 1.1080 **; 1,1180; 1.1300 **; 1.1450; 1.1550; 1.1650 *; 1.1720 **; 1.1850 **; 1,2100
Support Areas: 1,1080 **; 1,1000 ***; 1.0900 / 1.0950 **; 1.0850 **; 1,0500 ***; 1.0350 **; 1,0000 ***.
* Periodic level
** Range Level
*** Psychological level
***** The article is built on the principle of conducting a transaction, with daily adjustment