From a comprehensive analysis, we see that the corrective move is held as the fifth trading day, where the local ceiling has been almost reached. Now, about the details. There was an attempt to complete the correction when the quote abruptly changed its polarity and headed towards the level of 1.0850. However, the sellers did not manage to hold on. As a result, the quote returned to the opening point, having the Doji candle on the daily chart.
Is it worth raising panic in connection with the size of the correction? I believe that it is too early to inflate the noise since the quote is still below the level of 1.1000 and even more so below 1.1080. The fact of the resumption of the downward trend has already been confirmed, and now we only need time and a starting point for new short positions. Returning to the correction value, analyze the cycle of the downward movement (31.12.19-20.02.20) then compare it with the correction value and you will see that we have a standard cycle.
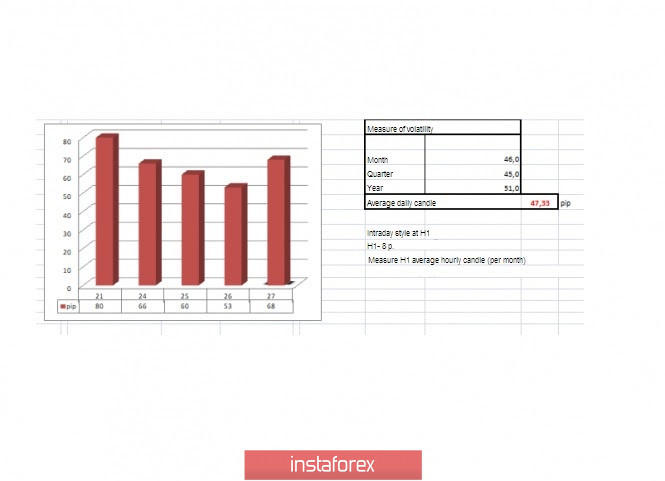
In terms of volatility, we see a steady acceleration that occurred last week. In fact, on a daily basis, we have an excess of the average daily indicator, which can not but please speculators.
Analyzing the past day by the minute, we see that the main bursts of activity occurred during the period of 14:00-18:00, where there was an attempt to resume the downward course. However, everything ended in the same place where it all began.
As discussed in the previous review, many traders are waiting for the downward trend to resume, however, they have not yet found a clear signal.
Looking at the trading chart in general terms (the daily period), we see that the current correction is the first since the oblong correction that tormented us for more than four months.
The news background of the previous day included data on new home sales in the United States, where growth was recorded from 708,000 to 764,000 with a forecast of 710,000.
There was no market reaction to positive statistical data.
In terms of the general information background, we have a wide stream of news. Let's look at it in order. The European Commission's mandate for negotiations on future relations with Britain was recently approved. And yesterday, a new committee was created to monitor the implementation of all the obligations of the Brexit agreement. This committee includes both representatives of the European Union and the UK. It is represented by the EU Vice-President of the European Commission, Maros Sefcovic.
In turn, the EU's chief negotiator, Michel Barnier, said ahead of the publication of the mandate for negotiations from Britain that competition should be fair and free.
"We want competition in the future, however, it must be fair. Honest and free. Free and fair. It should not be a problem for the UK to agree on a set of basic rules," said Michel Barnier.
We go further along the information background, where we encounter coronavirus. The outbreaks of the virus are recorded not only in the Asian region but also in the European and Western regions. Donald Trump spoke about the impact of the virus on the economy at a press conference at the White House on Wednesday. The US President believes that there is a risk of pressure on the US economy, but it will recover, and the country is projected to have an extremely low unemployment rate.
"We will have an extremely low unemployment rate. It is impossible to say exactly what will happen to the country's GDP, but the coronavirus will affect it," the head of the White House said.
Today, in terms of the economic calendar, we have the second preliminary estimate of the United States GDP for the fourth quarter, which is expected to coincide with the first estimate, which showed an acceleration in economic growth from 2.1% to 2.3%. In fact, this is a good signal for the medium-term growth of the dollar. Simultaneously with the GDP data, the figures for applications for unemployment benefits in the United States will be published, where they are expected to decrease by 9 thousand (Repeated: -11 thousand; Primary +2 thousand).
Further development
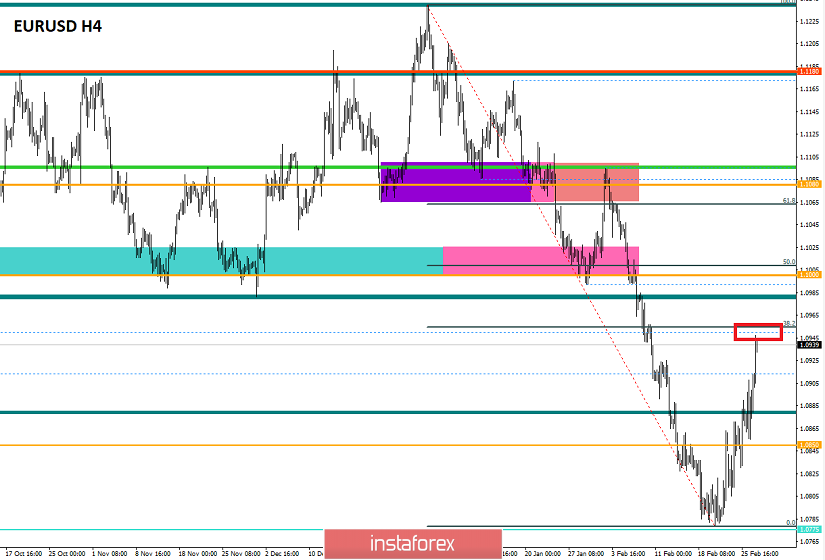
Analyzing the current trading chart, we see that the correction has resumed its course, bringing the quote closer to the Fibo level of 38.2, which we expected in the previous review. In fact, such a sharp acceleration, paired with a convergence with the control level, can provide an excellent platform for sellers who can return to the market in the very near future.
Detailing the available time interval every minute, we see that just from 00:00 hours on the trading terminal, there was a pulse upward move of more than 60 points. This activity could overheat long positions, which will play into the hands of sellers.
In turn, traders are still assessing the situation and are waiting for a rebound from the Fibo level of 38.2 (1.0950) in the downward direction.
It is likely to assume a temporary stagnation in the range of 1.0925/1.0955, where we are waiting for clarification, and most importantly confirmation that the correction has come to an end. The signals for the resumption of the downward trend will be impulse candles with the passage of 1.0925-1.0900.
Based on the above information, we will output trading recommendations:
- Buy positions will be considered if the price is fixed higher than 1.0960 with the prospect of a move to 1.1000.
- Sell positions will be considered gradually entry points 1.0925-1.0900.
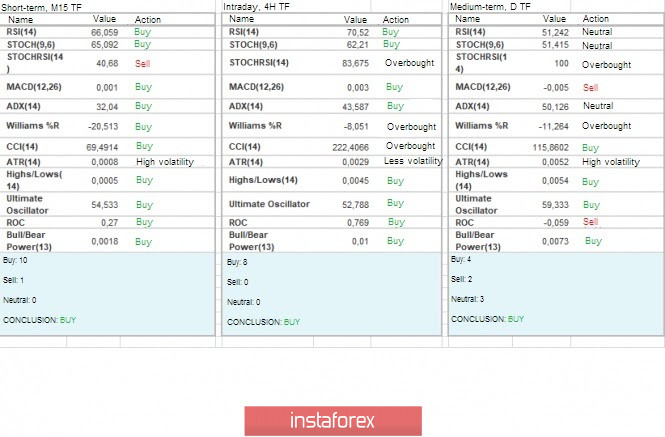
Indicator analysis
Analyzing different sectors of timeframes (TF), we see that the indicators of technical instruments tend to increase the quote due to the background correction. You should pay attention to the daily period, where the buy signal is controversial.
Volatility for the week / Volatility Measurement: Month; Quarter; Year.
The volatility measurement reflects the average daily fluctuation from the calculation for the Month / Quarter / Year.
(February 27 was based on the time of publication of the article)
The current time volatility is 68 points, which is already 44% higher than the daily average. It is likely to assume that volatility is already at its peak, but due to the information and news background, there is still a chance of further acceleration.
Key levels
Resistance zones: 1.0950**; 1.1000***; 1.1080**; 1.1180; 1.1300**; 1.1450; 1.1550; 1.1650*; 1.1720**; 1.1850**; 1.2100
Support zones: 1.0850**; 1.0775*; 1.0700; 1.0500***; 1.0350**; 1.0000***.
* Periodic level
** Range level
*** Psychological level
***** The article is based on the principle of conducting a transaction, with daily adjustments.