EUR/USD 5M

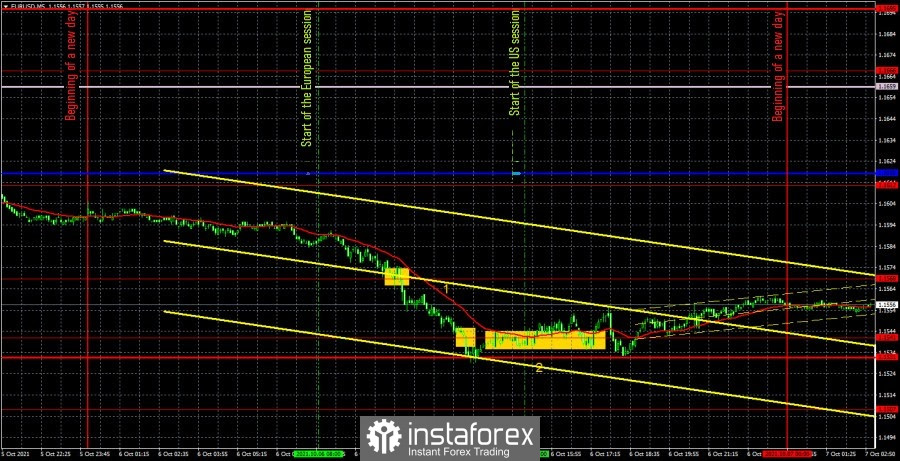
The EUR/USD pair did not trade in the best way again on Wednesday. This time, more than 70 points were passed from the high to the low of the day, which is very good, however, if in the first half of the day there was a downward movement, then in the second half it was practically flat. Thus, it was possible to earn money only in the first half of the day. At the same time, those two macroeconomic reports that were published yesterday had no effect on the pair. First, the data on retail trade in the European Union for August were published, which turned out to be much worse than the forecasts of experts (figure "1" in the chart), and then the ADP report on the number of employees in the US private sector (figure "2" in the chart). As you can see, a strong movement did not begin neither after the first report was released, nor after the second. In general, there were no changes in the pair's movement. Thus, it remains only to conclude that both reports were ignored. If there are no questions about the first of them, since it is really not the most important, then there are questions about the second, since ADP is still quite an important report that reflects the state of the labor market, which the Fed is very concerned about at this time. Therefore, the lack of market response is surprising. Moreover, the ADP value turned out to be twice as better than the previous one and one and a half times higher than the forecast. We could assume that now NonFarm Payrolls will also be strong on Friday. However, usually if the ADP report is strong, then the NonFarm Payrolls report is weak. Thus, no regularities can be drawn here. Now let's move on to considering trading signals. There weren't many of them. The first sell signal was formed when the price settled below the level of 1.1568, so it should have been worked out with a short position. Subsequently, the price dropped to the level of 1.1541 and even settled below it, but could not continue the downward movement and returned to the level of 1.1541, around which it spent 4 hours before starting a new upward movement. Thus, the short position had to be manually closed here, the profit on it was about 20 points. And when the upward movement began from the level of 1.1541, it was already necessary to open long positions, which could be manually closed again in profit late in the evening. As a result, the day turned out to be quite profitable for traders.
EUR/USD 1H
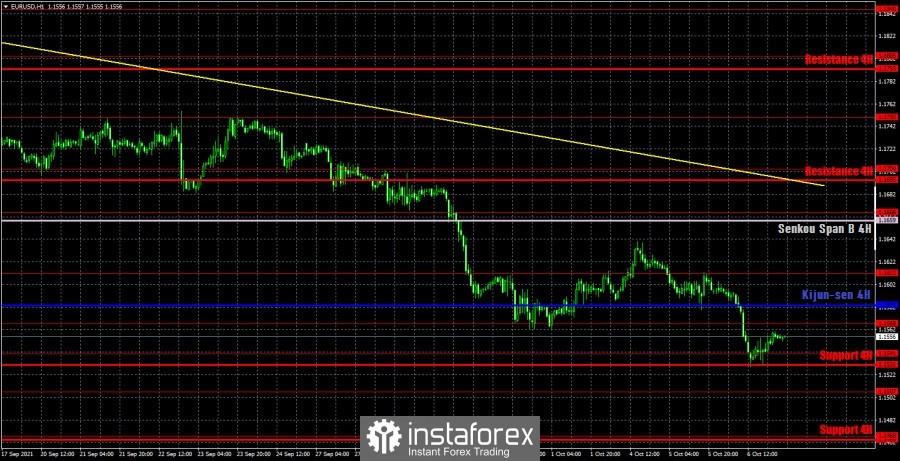
You can see that the euro/dollar pair continues to move down almost every day on the hourly timeframe. Even when there is no special reason for this. All of the pair's main movements during the day almost never coincide and do not depend on the macroeconomic reports that are published during the day. We believe that at this time a calm and confident bearish mood has developed on the market, which is the reason for the pair's decline. We highlight the following levels for trading on Thursday - 1.1541, 1.1568, 1.1612, 1.1666, 1.1704, as well as the Senkou Span B (1.1659) and Kijun-sen (1.1618) lines. The Ichimoku indicator lines can change their position during the day, which should be taken into account when looking for trading signals. Signals can be rebounds or breakthroughs of these levels and lines. Do not forget about placing a Stop Loss order at breakeven if the price moves 15 points in the right direction. This will protect you against possible losses if the signal turns out to be false. There will be no macroeconomic statistics at all on October 7. Neither in the European Union nor the United States. Of course, we can say something about the report on applications for unemployment benefits, but this week the markets have already ignored several much more significant reports. The pair will continue to move on pure technique.
We also recommend that you familiarize yourself with the forecast and trading signals for the GBP/USD pair.
COT report
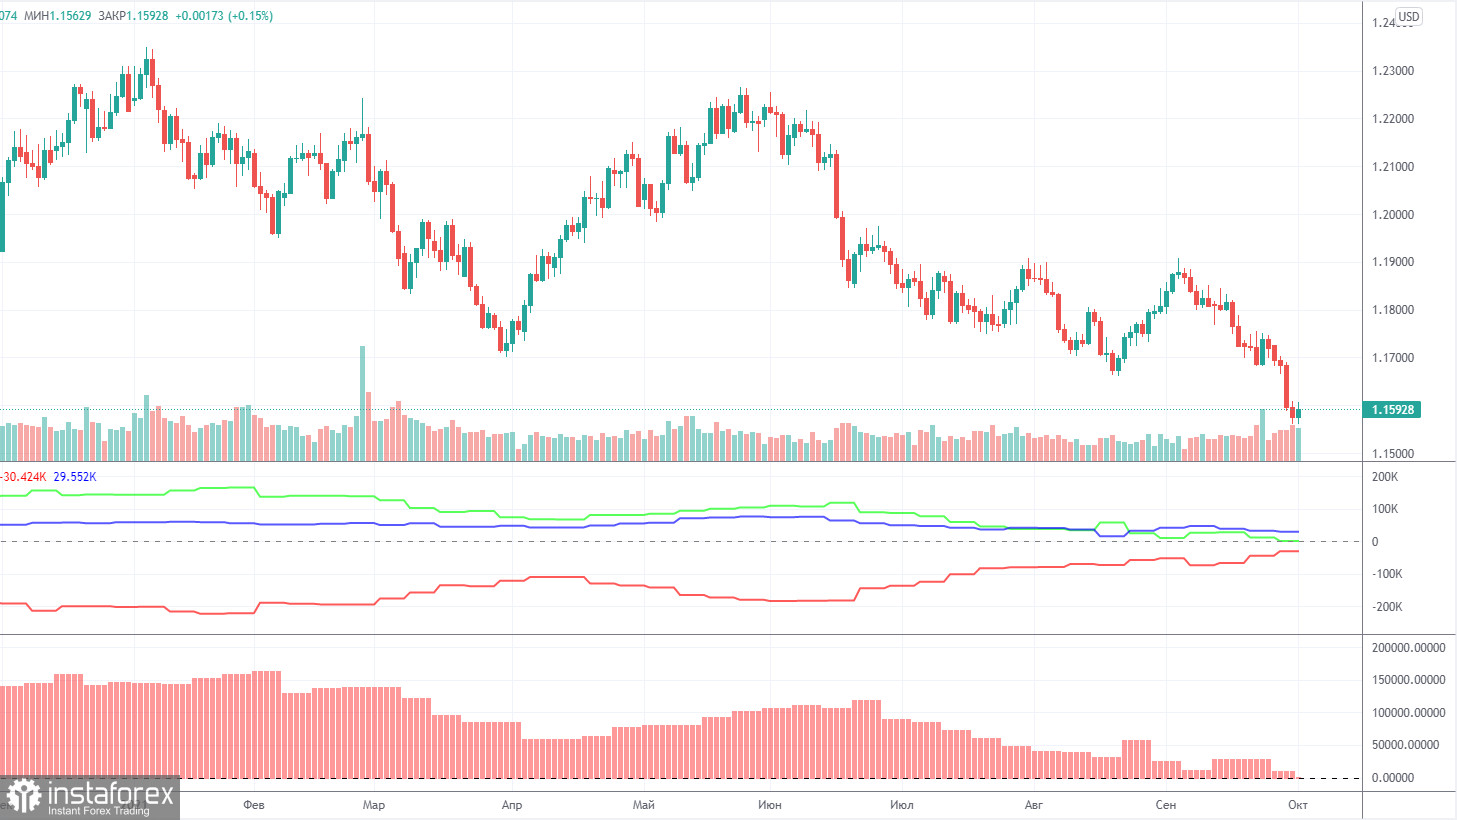
The mood of non-commercial traders became "less bullish" again during the last reporting week (September 21-27). And in the near future it may become fully bearish, because at the moment the number of buy and sell contracts for major players is practically the same. This means that the mood is "neutral" at this time, but this word does not accurately reflect what is happening in the market. According to the mood of professional traders, there is now a clear down trend. Thus, the mood is not "neutral". During the reporting week, the non-commercial group opened 7,000 buy contracts (longs) and 16,000 sell contracts (shorts). Thus, the net position decreased by 9,000. This is exactly what we talked about in the previous paragraph: traders at this time are actively getting rid of the euro currency, and, accordingly, buy the US dollar. Thus, at this time, the readings of the COT reports and the movement of the EUR/USD pair have a correlation. However, there are two important points to keep in mind. First, the Federal Reserve has not yet begun to roll back its QE. The second - the current downward movement - is still a correction against the global upward trend, in which the pair has been for a year and a half. Thus, the "foundation" and the COT reports give us the opportunity to assume that the euro will continue to fall. But, recall, each hypothesis and assumption must be confirmed by specific technical signals. Now these signals are there.
Explanations for the chart:
Support and Resistance Levels are the levels that serve as targets when buying or selling the pair. You can place Take Profit near these levels.
Kijun-sen and Senkou Span B lines are lines of the Ichimoku indicator transferred to the hourly timeframe from the 4-hour one.
Support and resistance areas are areas from which the price has repeatedly rebounded off.
Yellow lines are trend lines, trend channels and any other technical patterns.
Indicator 1 on the COT charts is the size of the net position of each category of traders.
Indicator 2 on the COT charts is the size of the net position for the non-commercial group.