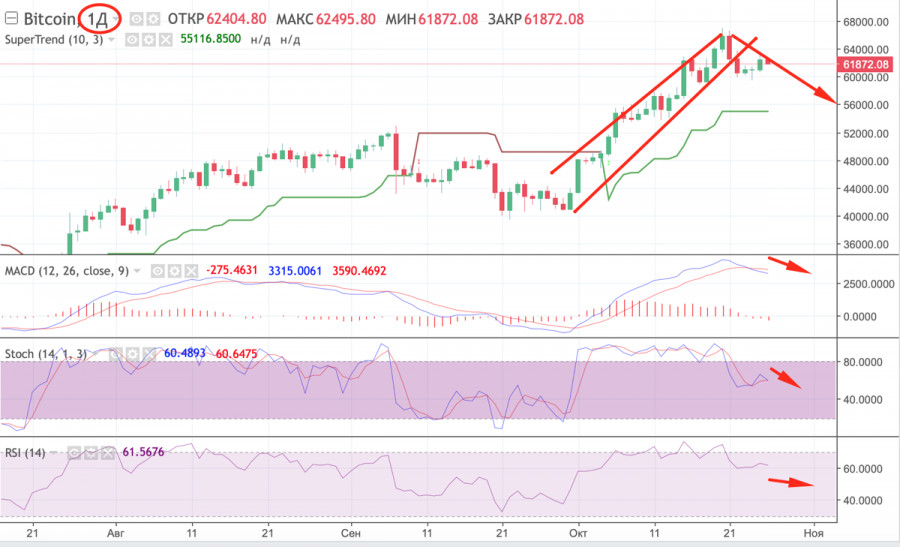
Bitcoin has returned above $63,000. It is going to test $63,500. Currently, there are big investments in BTC-based crypto assets. The leadership is still held by the futures market and ETF funds. Following its launch, the asset managed to move above $63,000. Apart from that, international companies are getting more interested in bitcoin and expanding opportunities for their customers. Tesla may also start accepting cryptocurrencies again as payment for its products.
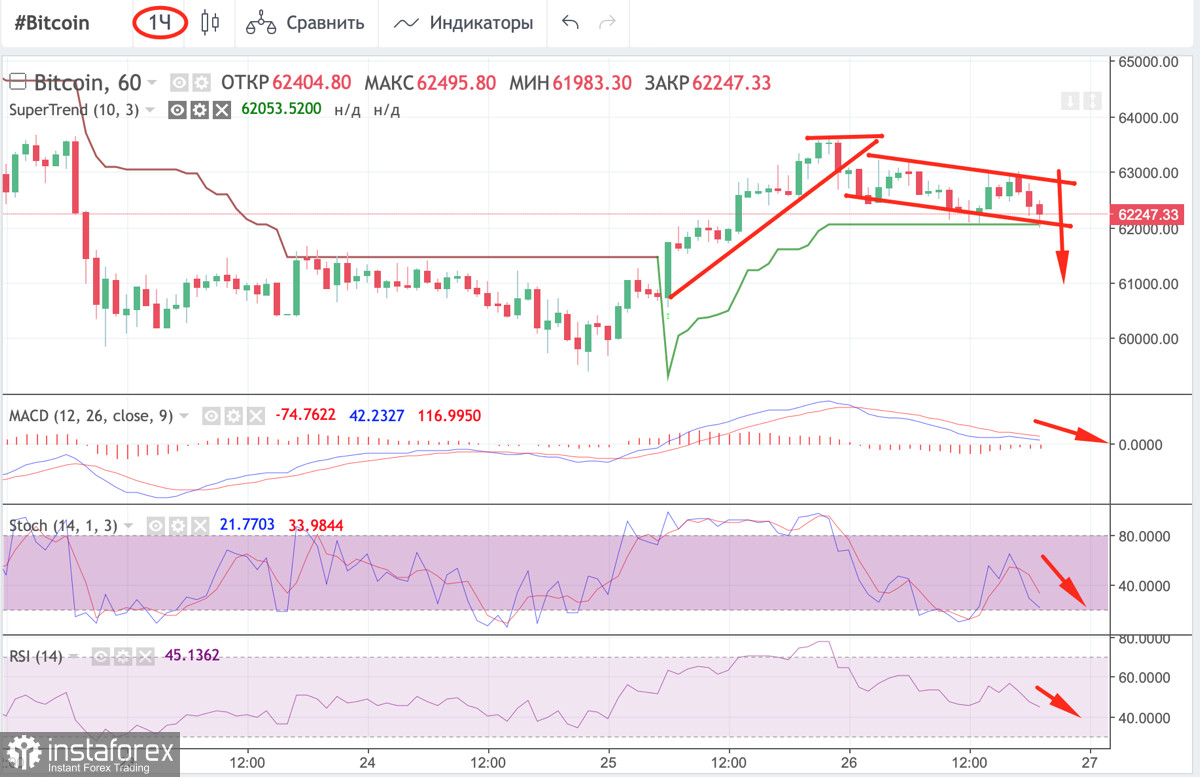
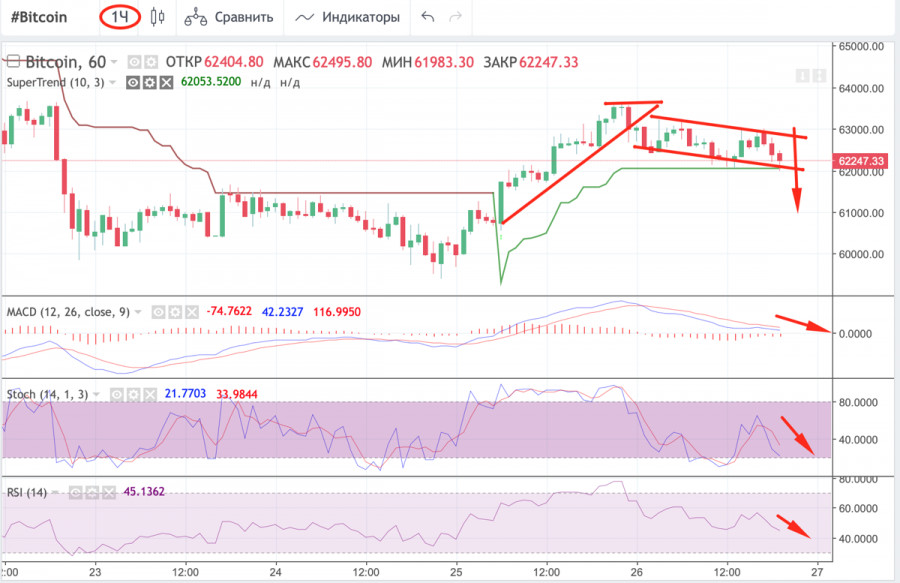
For this reason, BTC may resume an upward movement amid positive fundamental factors, as well as the growing on-chain activity in the bitcoin network. This is confirmed by the price movement, which managed to break through the important resistance level of $63,000. However, in order to make a more precise analysis, it is necessary to examine technical indicators and determine the most likely entry points for long positions and Stop Loss orders. There are no signs of the beginning of a rally on the 1H chart. On the contrary, the price is rapidly declining. It is likely to break through the super trend line, which will mean a change of the short-term trend to bearish. At the same time, MACD is moving sideways, but is gradually decreasing and may soon cross the zero level. The stochastic oscillator shows a downward movement, which indicates strong selling pressure and weak bullish momentum. It is gradually decreasing beyond the 40 level, which also signals a change in the short-term trend. The RSI indicator is still holding in the range of 40-50 and is beginning to level off, signaling attempts to regain ground. Yet, the price is highly likely to break through the super trend line and continue to decline. Such a sharp drop could lead to a retest of an important support level of $62,000-63,500. However, it is better to conduct an analysis of larger timeframes to confirm this trend.
On-chain activity is the actions of crypto market players who independently manage their crypto assets. This is why the record of the transition goes directly to the main blockchain. These statistics include both private investors and large companies. Price consolidation is the period when a certain cryptocurrency is located within a narrow horizontal price channel. Usually, it indicates the price stabilization or weakness of bulls or bears.
The Relative Strength Index (RSI) is a technical indicator that allows traders to determine the strength of a trend (descending or ascending) and possible changes in the price movement. Thanks to this indicator, it is possible to find out at what level an asset enters the overbought or oversold zone. If the indicator is located at 60, a bullish trend prevails. It indicates a high demand for the coin and the strength of the current upward momentum. When crossing this mark, the coin begins to move towards the overbought zone.
MACD (moving averages convergence/divergence index) is an indicator that allows traders to identify the trend based on the movement of moving averages and values between them. The bullish signal is the intersection of the white line under the red. When the white line from above crosses the red it indicates a downward movement.
Stochastic (stochastic oscillator) indicates the strength of the momentum of the current prevailing trend. If the indicator is above the 80 mark, then the asset can be considered overbought. If the stochastic is below 20, then the asset enters the oversold zone.
The super trend line is a technical indicator reflecting a bullish (green - a buy signal) and bearish (red - a sell signal) trend on the horizontal charts.
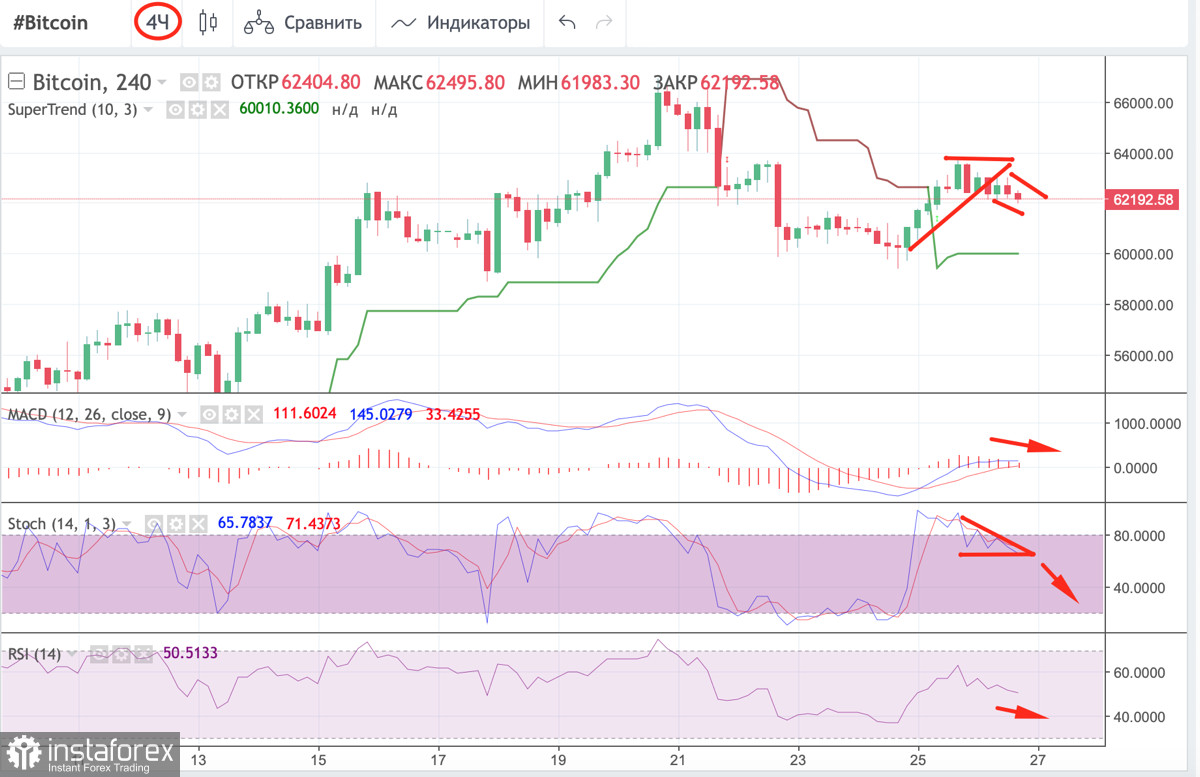
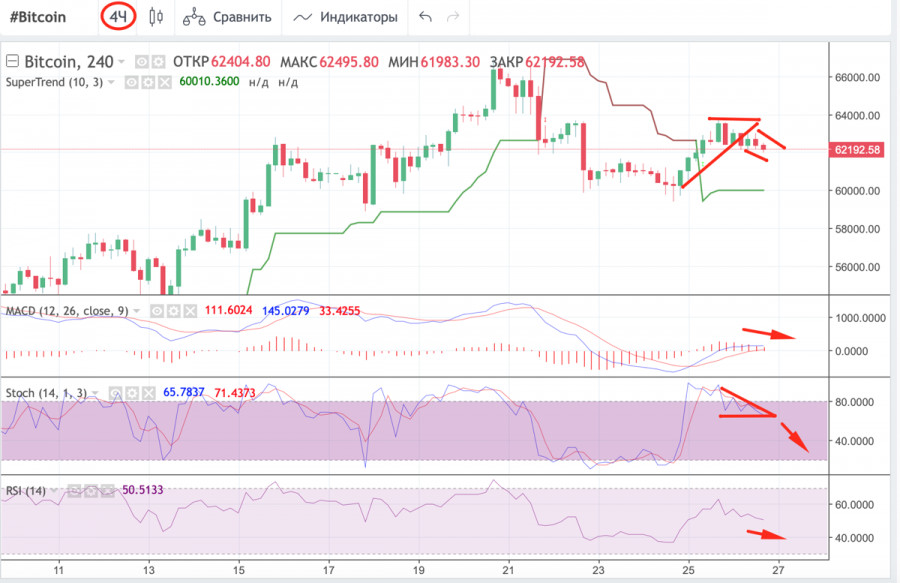
The 4H chart confirms the change in the short-term trend. However, a drop was rather small. Bulls tried to gold the price near the support level, but bears managed to push the quotes below it. As a result, the pair declined on small timeframes. The price may decline to $59,700-61,500. The MACD is moving along the red zone. It failed to make a bullish intersection. So, it is moving sideways. It gradually starts tumbling. The stochastic oscillator has broken through the descending triangle. It continues to decline to the 40 level. At the same time, the relative strength index maintains its sideways movement on a smaller timeframe, which indicates attempts of bulls to push the price out of the descending channel. However, bitcoin is likely to will to fall further. In order to determine a possible rebound level, it is necessary to switch to the daily chart.
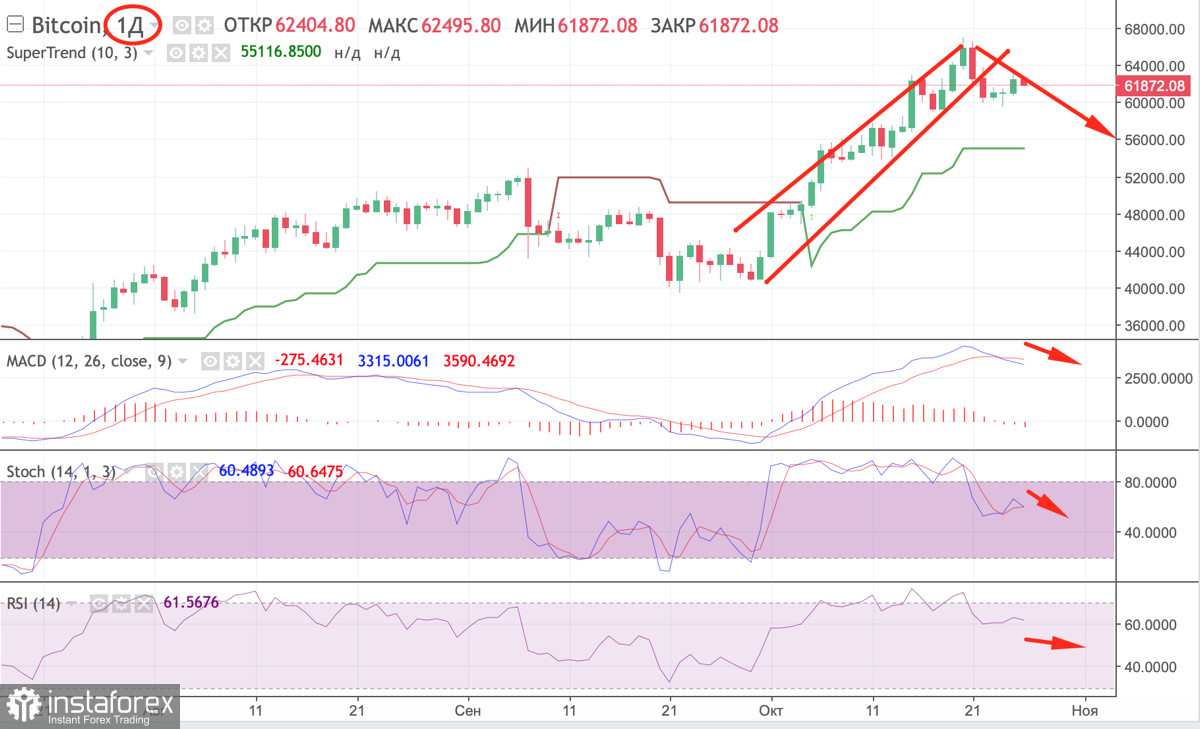
On the daily chart, bitcoin formed a weak bullish candlestick following the results of the previous trading day. Apparently, bulls are unable to take the upper hand. Institutional investors may push the price up below $60,000. After the recent increase in the volume of closed Profit Take orders by long-term investors, there are many coins circulating in the market. In order to acquire them, the whales deliberately try to push the price down. By buying coins at $56,600-60,000, major market players may stabilize the price. So, a rally to $63,000-65,000 may occur. On the daily chart, technical indicators show a decline below the $62,00-63,500. The MACD has formed a bearish intersection and continues to decline. The stochastic is located around 50. It has formed the same formation and will soon begin to decline. Apparently, bulls will lose ground in the medium term. The relative strength index continues to decline slowly, which indicates an increase in bearish pressure and the weakness of bulls. So, BTC is likely to fall to $60,000-61,500 with the targets located below $60,000.