empty
 
 
19.09.2022 06:06 AM
Elliott wave analysis of Litecoin for September 19, 2022

This image is no longer relevant

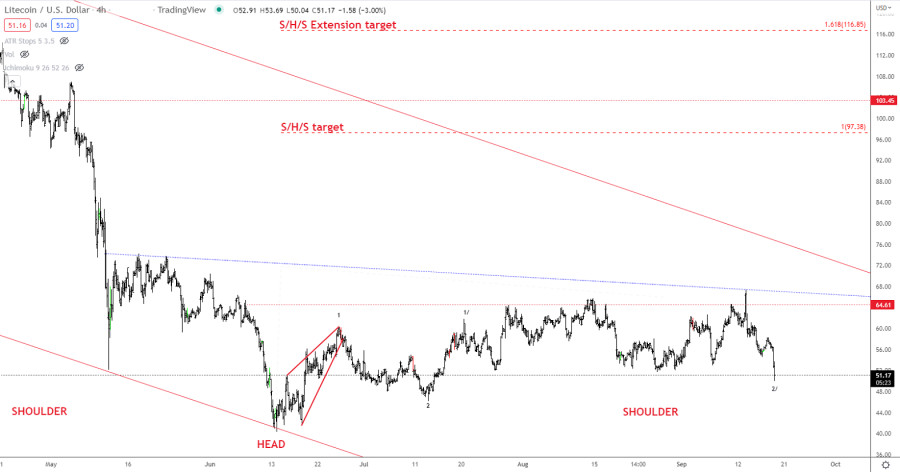
The break below support at 51.70 has changed the short-term count slightly and tells us that wave 2/ has already been completed. We don't expect a much deeper correction than we have already seen, but we will need proof that the corrective low in wave 2/ is in place. For that proof, we need a see break above 58.31 that will signal a re-test of the S/H/S bottom neckline at 67.40 and above here, it will call for a continuation higher to the S/H/S-target seen at 97.38.

As long as resistance at 58.31 is able to cap the upside, we could see Litecoin test 48.31 and the high of 46.21. A break below the latter will indicate that not even wave 2 has been completed.

Torben Melsted,
Analytical expert of InstaForex
© 2007-2023
EURUSD
Euro vs US Dollar
Select timeframe
5
min
15
min
30
min
1
hour
4
hours
1
day
1
week
Start trade
Start trade
  • Grand Choice
    Contest by
    InstaForex
    InstaForex always strives to help you
    fulfill your biggest dreams.
    JOIN CONTEST
  • Chancy Deposit
    Deposit your account with $3,000 and get $1000 more!
    In April we raffle $1000 within the Chancy Deposit campaign!
    Get a chance to win by depositing $3,000 to a trading account. Having fulfilled this condition, you become a campaign participant.
    JOIN CONTEST
  • Trade Wise, Win Device
    Top up your account with at least $500, sign up for the contest, and get a chance to win mobile devices.
    JOIN CONTEST
  • 100% Bonus
    Your unique opportunity to get a 100% bonus on your deposit
    GET BONUS
  • 55% Bonus
    Apply for a 55% bonus on your every deposit
    GET BONUS
  • 30% Bonus
    Receive a 30% bonus every time you top up your account
    GET BONUS

Recommended Stories

EUR/USD. Analysis for March 31, 2023

The last upward wave has caused more confusion with the wave analysis on the 4-hour chart for the euro/dollar pair. Given that the previous descending segment can be viewed

Chin Zhao 18:33 2023-03-31 UTC+2

Elliott wave analysis of UNG for March 31, 2023

Our proxy for Natural Gas, UNG, is in the very final stages for the decline from 34.50. We think that a final spike to just below 6.58 could be seen

Torben Melsted 06:13 2023-03-31 UTC+2

Elliott wave analysis of EUR/USD for March 31, 2023

EUR/USD is challenging resistance at 1.0930. A break above here will open the door for a higher move towards resistance at 1.1033 on the way higher to the first upside

Torben Melsted 06:09 2023-03-31 UTC+2

GBP/USD. Analysis for March 30, 2023

The wave analysis for the pound/dollar pair now appears challenging, but it does not call for any clarifications. There are some differences between the wave patterns of the euro

Chin Zhao 16:44 2023-03-30 UTC+2

EUR/USD. Analysis for March 30. The euro continues to build an upward set of waves

The last upward wave has caused more confusion with the wave analysis on the 4-hour chart for the euro/dollar pair. Given that the previous descending segment can be viewed

Chin Zhao 16:12 2023-03-30 UTC+2

Elliott wave analysis of EUR/JPY for March 30, 2023

The long-term picture of EUR/JPY shows that a multi-year triangle completed with the test of 114.20 in May 2020 and a new impulsive rally was initiated. This rally has much

Torben Melsted 07:45 2023-03-30 UTC+2

Elliott wave analysis of USD/JPY for March 30, 2023

Today we will take a view of the long-term picture of USD/JPY. After the peak in October 2022 at 151.94, we have seen wave A move lower to test support

Torben Melsted 07:37 2023-03-30 UTC+2

GBP/USD. Analysis for March 29. The pound continues to form an unclear wave

The wave analysis for the pound/dollar pair now appears challenging, but it does not call for any clarifications. There are some distinctions between the wave patterns of the euro

Chin Zhao 17:51 2023-03-29 UTC+2

EUR/USD. Analysis for March 29. The market is waiting for a new acceleration of core inflation in the European Union.

The final upward wave continues to confuse the wave pattern on the 4-hour chart for the euro/dollar pair. Since the previous downward trend segment can be viewed as a three-wave

Chin Zhao 17:31 2023-03-29 UTC+2

Elliott wave analysis of EUR/USD for March 29, 2023

EUR/USD has rallied nicely of the 50% corrective target at 1.0723 and is currently testing short-term important resistance at 1.0840. A clear break above here will confirm that the correction

Torben Melsted 07:39 2023-03-29 UTC+2
现在无法通话?
提出您的问题,用 在线帮助.