Analysis of Friday's deals:
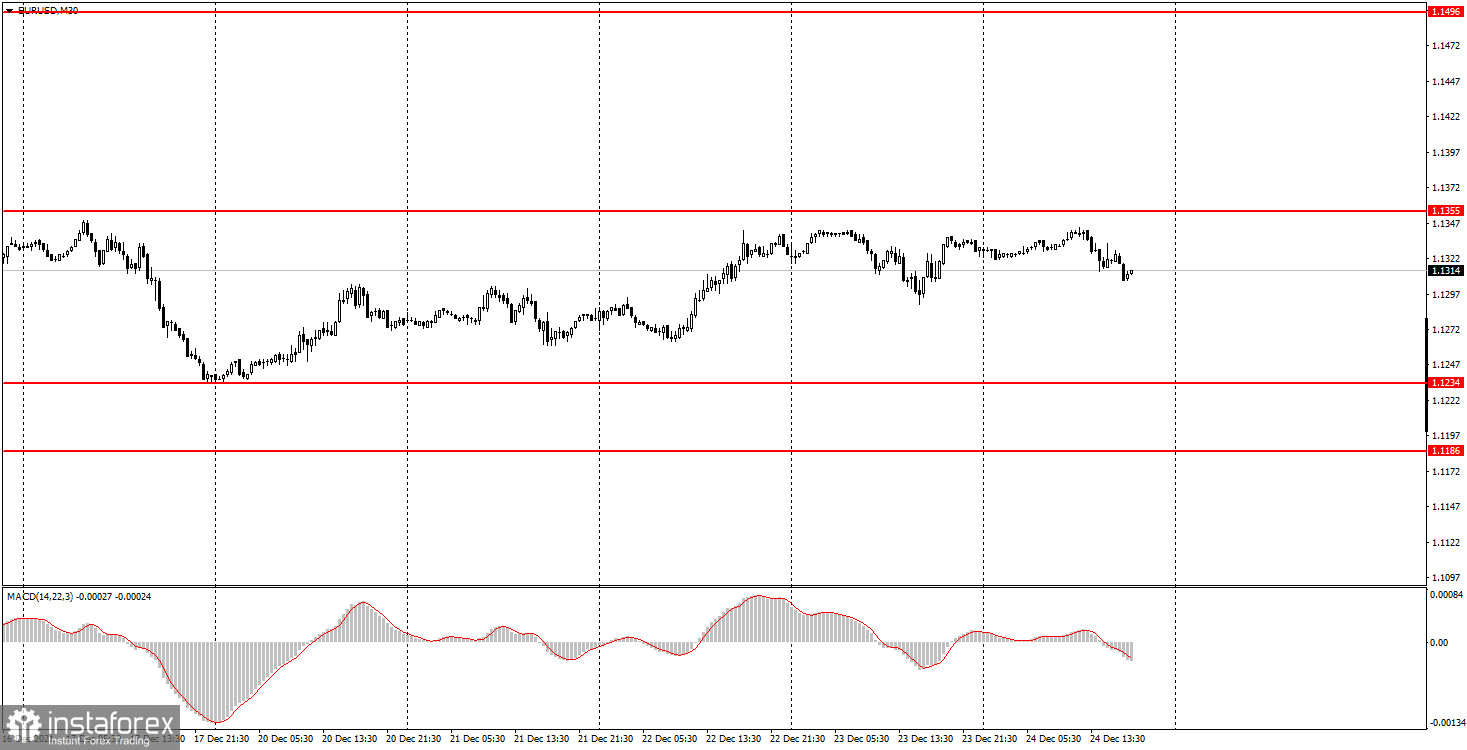
30M chart of the EUR/USD pair.
The EUR/USD currency pair continued to stay inside the side channel on Friday, between the levels of 1.1234 and 1.1355. It has remained within its limits for a month, so every time, every day on a 30-minute timeframe, nothing new can be added – the pair continues to stay inside the flat every day. During today's trading session, the pair's quotes even showed a slight movement, although we thought there would be no movement at all. The market closes earlier today than usual, Christmas will be celebrated tomorrow in the Catholic style, and today was a pre-holiday and semi-holiday day. Thus, the volatility of 40 points looks ultra-high today. Needless to say, there was not a single important macroeconomic report or fundamental event during Friday? Needless to say, there was not a single trading signal on the current TF? The pair finished the current week almost perfectly, because on Monday there was a rebound from the level of 1.1234 (the lower limit of the side channel), and on Friday the price was near the upper limit.
5M chart of the EUR/USD pair.
On the 5-minute timeframe, the pair's movements on Friday were as neutral and fresh as possible. The movements were also weak, so it was not necessary to count on a large number of trading signals. They did not exist at all, although in the middle of the European trading session the price approached the distance of 3 points to the level of 1.1348 and could have rebounded from it, but still did not do it. Thus, not a single trading signal was formed during the day. Next week, the pair may continue to stay inside the side channel, and it may still be very tense with signals.
How to trade on Monday:
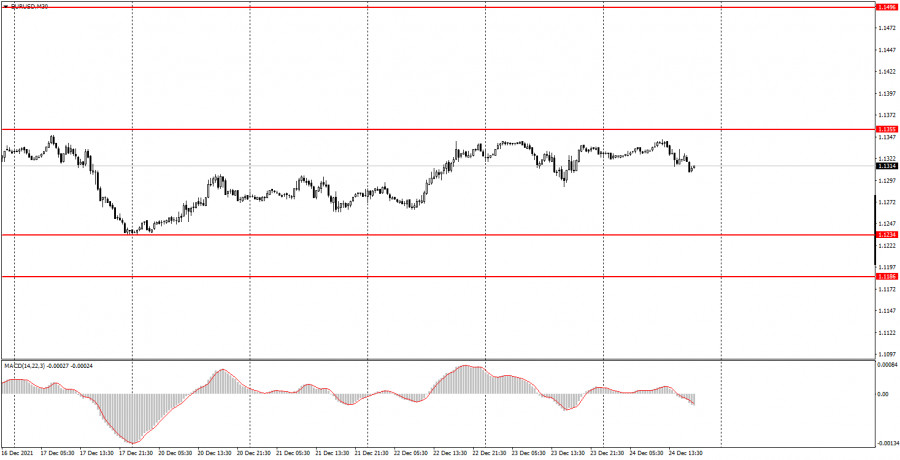
On the 30-minute timeframe, the euro/dollar pair continues to be in the side channel 1.1234-1.1355. The price rose from the lower to the upper limit, and if a rebound from 1.1355 followed, then the probability of a new fall to 1.1234 would be very high. It is already available, but still, there was no clear signal to sell. On the 5-minute timeframe, the key levels for December 27 are 1.1262, 1.1290, 1.1348-1.1355, 1.1422. Take Profit, as before, we set at a distance of 30-40 points. Stop Loss - breakeven when the price passes in the right direction by 15 points. At 5M TF, the target can be the nearest level, if it is not located too close or too far away. If it is located– then you should act on the situation or work on Take Profit. There are no important events or reports scheduled for Monday in the European Union and America. Thus, novice traders will again have nothing to turn their attention to during the day.
Basic rules of the trading system:
1) The strength of the signal is calculated by the time it took to generate the signal (rebound or overcome the level). The less time it took, the stronger the signal.
2) If two or more trades were opened near a certain level on false signals (which did not trigger Take Profit or work out the nearest target level), then all subsequent signals from this level should be ignored.
3) In a flat, any pair can form a lot of false signals or not form them at all. But in any case, at the first signs of a flat, it is better to stop trading.
4) Trade deals are opened in the period between the beginning of the European session and the middle of the American session when all transactions must be closed manually.
5) On a 30-minute TF, signals from the MACD indicator can be traded only if there is good volatility and a trend, which is confirmed by a trend line or a trend channel.
6) If two levels are located too close to each other (from 5 to 15 points), then they should be considered as a support or resistance area.
What's on the charts:
Price support and resistance levels - target levels when opening purchases or sales. Take Profit levels can be placed near them.
Red lines - channels or trend lines that display the current trend and show in which direction it is preferable to trade now.
MACD indicator (14, 22, 3) - a histogram and a signal line, the intersection of which are signals to enter the market. It is recommended to use it in combination with trend constructions (channels, trend lines).
Important speeches and reports (always contained in the news calendar) can greatly influence the movement of a currency pair. Therefore, during their exit, it is recommended to trade as carefully as possible or exit the market to avoid a sharp price reversal against the previous movement.
Beginners in the Forex market should remember that every trade cannot be profitable. The development of a clear strategy and money management is the key to success in trading over a long period.