Analyzing trades on Wednesday
EUR/USD on 30M chart
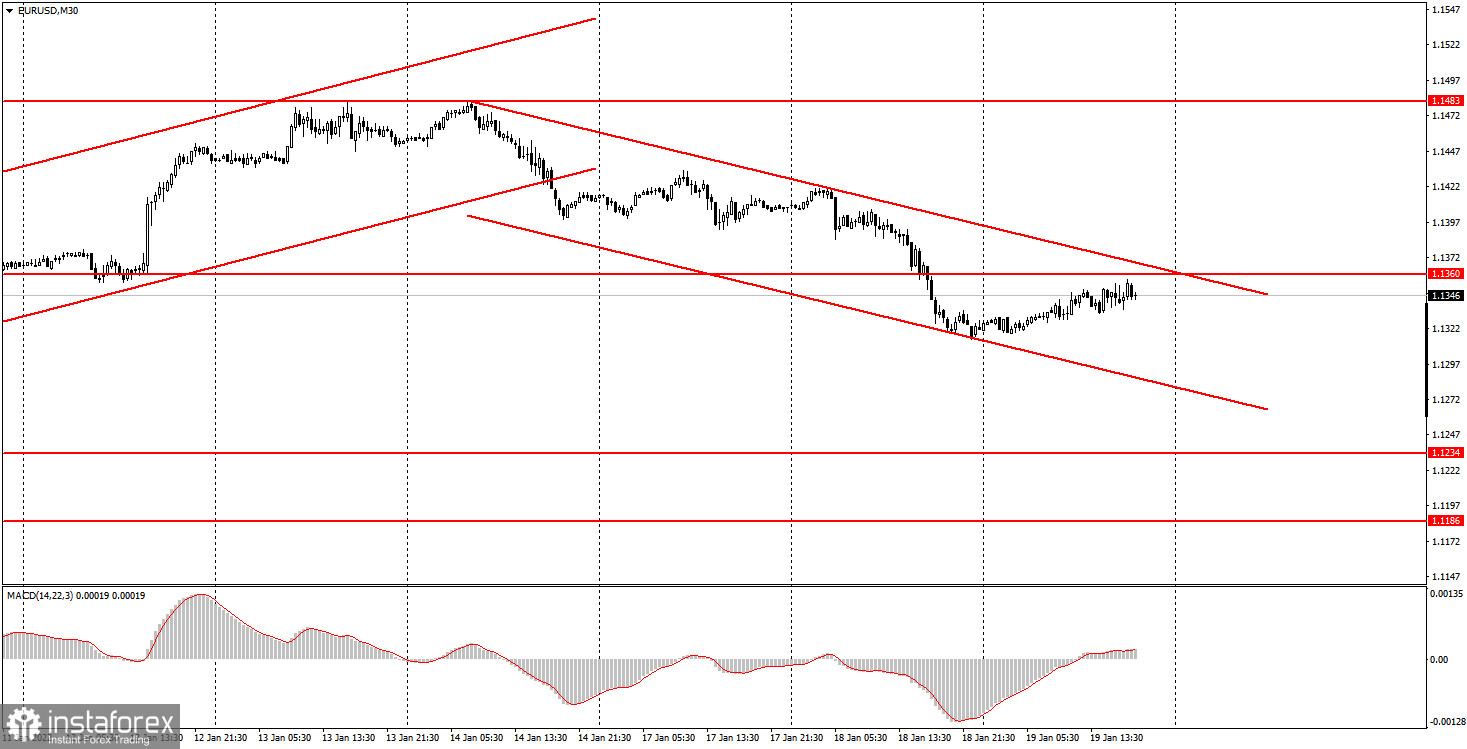
On Wednesday, the EUR/USD pair was cautiously trading in one direction for the whole day. A day earlier, it formed a new downward channel where the movement took place. During the day, the euro/dollar pair managed to add about 40 pips and approached the upper boundary of the channel and the level of 1.1360. However, the price did not rebound either from the first or from the second one. So no new sell signal was received. As long as the price stays inside the descending channel, the pair is more likely to fall. The volatility was low on Wednesday. There was no macroeconomic background, so novice traders had nothing to analyze during the day.
EUR/USD on 5M chart
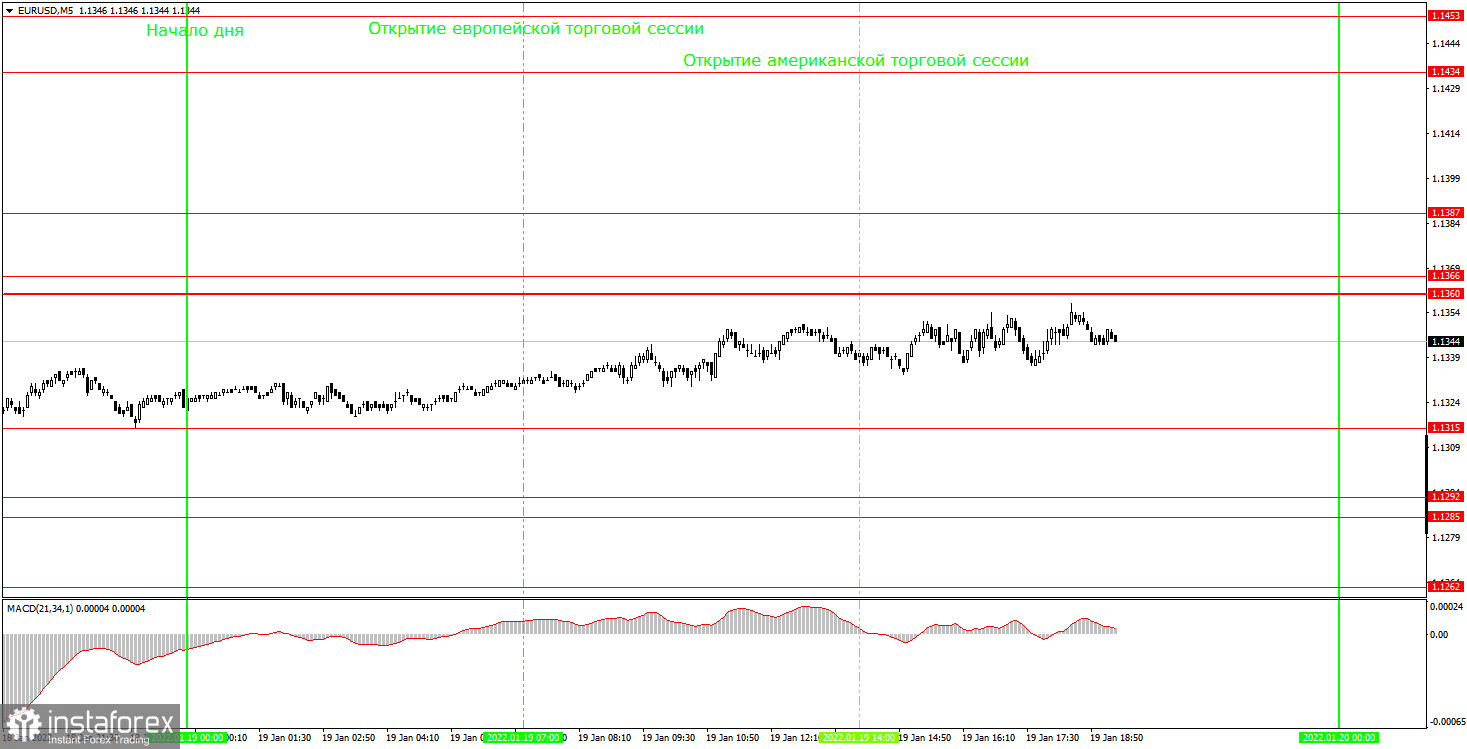
On the 5-minute timeframe, the movement looks just as sluggish as on the 30-minute chart Throughout the day, there was a slight upward movement, but not a single level on the chart had been tested. This means that no new trading signals were generated. On the one hand, it was good for us since we could hardly earn anything with such a flat movement. However, the pair may now return to the sideways channel that it left just a week ago. If this happens, then we will witness a new long-term flat movement. Only the Fed meeting next week or traders' activity can save the situation. At the same time, we would like to remind you that the last Fed's meeting in December did not help the pair to leave the flat channel. A short-term market reaction is possible, but the price is still likely to stay within the range of 1.1234-1.1360.
Trading tips for Thursday
A new downtrend has been formed on the 30-minute timeframe as well as a descending channel. It is quite narrow, so if the movement continues for more than a few days, this channel may expand over time. The pair is already quite close to its upper boundary. So there is a risk that the price may return to the channel of 1.1234-1.1360. We believe that in the coming weeks, the euro may drop to the level of 1.1234. Hopefully, it will not start a new flat movement. On the 5-minute timeframe, the pair will open the trade on Thursday between 1.1315 and 1.1360. A breakout of any of these levels will serve as a signal. In general, there are quite a lot of levels on the chart now. So you need to be more careful with rebounds within the trend movement on the intraday chart (if a trend is formed on Thursday). The macroeconomic background will be weak tomorrow. Beginners may pay attention to the inflation report in the European Union or the initial jobless claims report in the US. However, we think that this data will hardly cause any market reaction.
Basic rules of the trading system
1) The strength of the signal is determined by the time it took the signal to form (a bounce or a breakout of the level). The quicker it is formed, the stronger the signal is.
2) If two or more positions were opened near a certain level based on a false signal (which did not trigger a Take Profit or test the nearest target level), then all subsequent signals at this level should be ignored.
3) When trading flat, a pair can form multiple false signals or not form them at all. In any case, it is better to stop trading at the first sign of a flat movement.
4) Trades should be opened in the period between the start of the European session and the middle of the US trading hours when all positions must be closed manually.
5) You can trade using signals from the MACD indicator on the 30-minute time frame only amid strong volatility and a clear trend that should be confirmed by a trendline or a trend channel.
6) If two levels are located too close to each other (from 5 to 15 pips), they should be considered support and resistance levels.
On the chart
Support and Resistance Levels are the levels that serve as targets when buying or selling the pair. You can place Take Profit near these levels.
Red lines are channels or trend lines that display the current trend and show in which direction it is better to trade now.
The MACD indicator (14, 22, and 3) consists of a histogram and a signal line. When they cross, this is a signal to enter the market. It is recommended to use this indicator in combination with trend patterns (channels and trendlines).
Important announcements and economic reports that you can always find on the economic calendar can seriously influence the trajectory of a currency pair. Therefore, at the time of their release, we recommend trading as carefully as possible or exiting the market in order to avoid sharp price fluctuations.
Beginners on Forex should remember that not every single trade has to be profitable. The development of a clear strategy and money management is the key to success in trading over a long period of time.