empty
 
 
22.11.2022 03:04 PM
NZDUSD Potential for Bearish Drop | 22nd November 2022

This image is no longer relevant

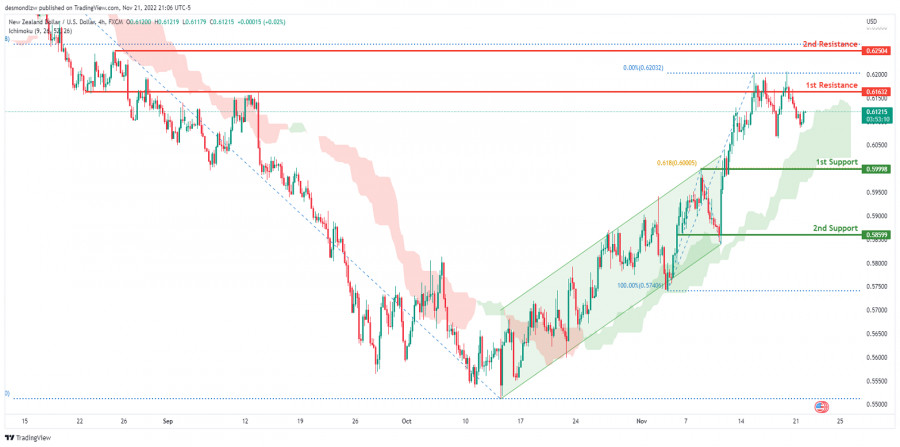
On the H4 chart, the price is moving above the Ichimoku cloud and has broken out of the ascending channel. If this bullish momentum continues, the price may break the 1st resistance at 0.61632, which is in line with the previous swing high and 0% fibonacci line, before heading towards the 2nd resistance line at 0.62504, where the 78.6% Fibonacci line is. Alternatively, the price may head back towards the 1st support at 0.59998, where the 61.8% Fibonacci projection line is located.

Trading Recommendation

Entry: 0.61565

Reason for Entry:

1st resistance line

Take Profit: 0.59998

Reason for Take Profit:1st support line and 61.8% Fibonacci projection line

Stop Loss: 0.62504

Reason for Stop Loss:

2nd resistance line and previous swing high

Dean Leo,
Analytical expert of InstaForex
© 2007-2023
NZDUSD
New Zealand Dollar vs US Dollar
Select timeframe
5
min
15
min
30
min
1
hour
4
hours
1
day
1
week
Start trade
Start trade
NZDUSD, H4 | Potential Bearish Reversal
The NZD/USD chart currently displays a bearish momentum, with price below a major descending trend line and the bearish Ichimoku cloud. The potential price movement could involve a bearish reaction off the 1st resistance, leading to a drop towards the 1st support level. At 0.6097, the 1st support.
作者: Dean Leo
04:46 2023-03-20 UTC--4
1900
XAUUSD, Day | Potential Bearish Reversal from?
Gold prices have been experiencing a bearish trend for some time now, which is reinforced by a major descending trend line on the XAU/USD chart. The current price could potentially move between the first support and resistance levels. The first support level is a multi-swing low support at 1881, wh.
作者: Dean Leo
04:45 2023-03-20 UTC--4
1900
EURUSD, Day | Potential reversel?
The EUR/USD pair has bullish momentum and may move towards the 1st resistance level. Pullback support at 1.0478, coinciding with the 38.20% Fibonacci retracement level, is currently supporting the price. If the price bounces from this support, it could reach the 1st resistance level at 1.1001, a si.
作者: Dean Leo
04:44 2023-03-20 UTC--4
1930
展示更多
  • Grand Choice
    Contest by
    InstaForex
    InstaForex always strives to help you
    fulfill your biggest dreams.
    JOIN CONTEST
  • Chancy Deposit
    Deposit your account with $3,000 and get $8000 more!
    In March we raffle $8000 within the Chancy Deposit campaign!
    Get a chance to win by depositing $3,000 to a trading account. Having fulfilled this condition, you become a campaign participant.
    JOIN CONTEST
  • Trade Wise, Win Device
    Top up your account with at least $500, sign up for the contest, and get a chance to win mobile devices.
    JOIN CONTEST
  • 100% Bonus
    Your unique opportunity to get a 100% bonus on your deposit
    GET BONUS
  • 55% Bonus
    Apply for a 55% bonus on your every deposit
    GET BONUS
  • 30% Bonus
    Receive a 30% bonus every time you top up your account
    GET BONUS

Recommended Stories

EURUSD, Day | Potential reversel?

The EUR/USD pair has bullish momentum and may move towards the 1st resistance level. Pullback support at 1.0478, coinciding with the 38.20% Fibonacci retracement level, is currently supporting the price

Dean Leo 09:44 2023-03-20 UTC+2

GBPUSD, H4 | Potential reversel from trendline?

The GBP/USD chart currently exhibits bearish momentum, as the price remains below a significant descending trend line. This indicates that the currency pair may undergo further downward pressure

Dean Leo 08:05 2023-03-17 UTC+2

AUDUSD, H4 | Potential reversel from trendline?

Price is approaching our 1st resistance level at 0.6694 along with a 61.8% Fibonacci retracement. If the price were to break above, it could push up to 2nd resistance

Dean Leo 10:10 2023-03-16 UTC+2

USDJPY, H1 | Time to Buy?

The price has recently reversed from our 1st resistance level at 135.18, which lines up with the 50% Fibonacci retracement. Additionally, it appears that the price has broken through

Dean Leo 19:39 2023-03-15 UTC+2

DAX, D1 | Trend line breakout

Price has broken an ascending trend line suggesting we might see a big bearish move. There's also a strong bearish divergence vs Stochastic lending more confidence to our bearish call

Dean Leo 06:36 2023-03-14 UTC+2

USDCHF, H4 | Potential bearish breakout after trend line break?

Price is testing a major support at 0.9283 which is a 50% Fibonacci retracement and an overlap support. If price were to break this level, we could see it drop

Dean Leo 11:42 2023-03-10 UTC+2

GBPJPY, H4 | Could price bounce from here?

Price is testing a major support level at 161.80 which is an overlap support and also seeing support from an ascending trendline. There's a chance that it might bounce from

Dean Leo 18:21 2023-03-09 UTC+2

Can ETHUSD Drop to 1512?

Price is in a bearish channel and a reversal from 1591 could see prices drop all the way to 1512 which is a strong overlap support. Do watch

Dean Leo 17:39 2023-03-07 UTC+2

Potential WTI Rally?

Price is testing a major support of 78.37 which is an overlap support and a Fibonacci retracement. We could see a bounce from here taking prices up to 79.87. It's

Dean Leo 14:47 2023-03-06 UTC+2

Could we see BCOUSD drop?

BCOUSD is testing a descending resistance line - and a break of our support at 83.97 could trigger a move down to the take profit target of 79.60. In terms

Dean Leo 09:15 2023-03-03 UTC+2
现在无法通话?
提出您的问题,用 在线帮助.