empty
 
 
02.12.2022 03:45 PM
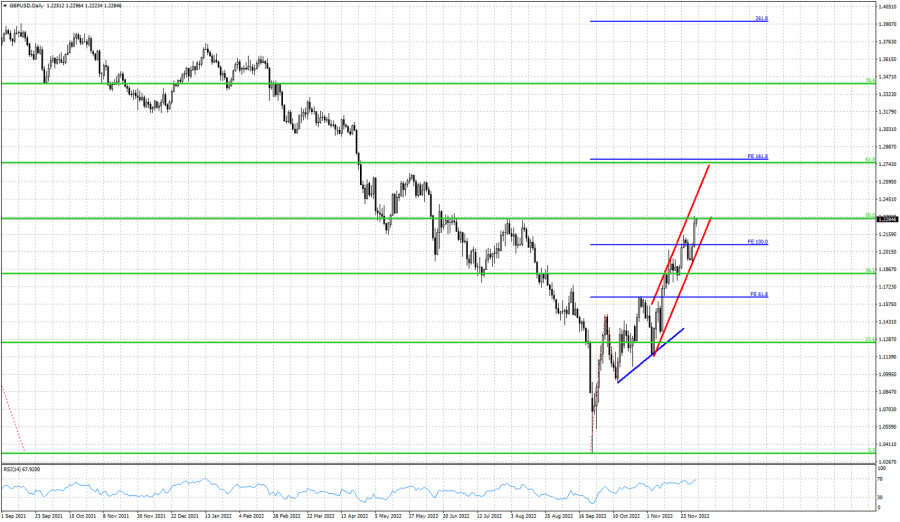
Short-term technical analysis on GBPUSD for December 2nd, 2022.

This image is no longer relevant

Blue horizontal lines- Fibonacci extension targets

Green lines- Fibonacci retracement levels

Blue upward sloping line- support trend line

Red lines- bullish channel

GBPUSD is inside a short-term bullish channel making higher highs and higher lows. In our previous analysis we noted that our next focus would be the 1.23 target. At 1.23 we find the 50% Fibonacci retracement of the entire decline. As long as price is inside the bullish channel and above 1.2015, bulls will remain in control of the trend. The RSI has not provided a bearish divergence yet. Nevertheless bulls should be cautious at the end of the week. GBPUSD is near important Fibonacci resistance level and at the end of the trading week we could see profit taking after such a strong bull run.

GBPUSD
Great Britain Pound vs US Dollar
Select timeframe
5
min
15
min
30
min
1
hour
4
hours
1
day
1
week
Start trade
Start trade
  • Grand Choice
    Contest by
    InstaForex
    InstaForex always strives to help you
    fulfill your biggest dreams.
    JOIN CONTEST
  • Chancy Deposit
    Deposit your account with $3,000 and get $8000 more!
    In March we raffle $8000 within the Chancy Deposit campaign!
    Get a chance to win by depositing $3,000 to a trading account. Having fulfilled this condition, you become a campaign participant.
    JOIN CONTEST
  • Trade Wise, Win Device
    Top up your account with at least $500, sign up for the contest, and get a chance to win mobile devices.
    JOIN CONTEST
  • 100% Bonus
    Your unique opportunity to get a 100% bonus on your deposit
    GET BONUS
  • 55% Bonus
    Apply for a 55% bonus on your every deposit
    GET BONUS
  • 30% Bonus
    Receive a 30% bonus every time you top up your account
    GET BONUS

Recommended Stories

Forecast for EUR/USD on March 28. ECB's de Cos: regulator will monitor incoming information more closely

On Monday, the EUR/USD pair rebounded from the 1.0750 level and carried on its upward trend toward the corrective level of 200% (1.0861). The US dollar will benefit from

Samir Klishi 17:29 2023-03-28 UTC+2

Forecast for GBP/USD on March 28, 2023

The GBP/USD pair increased on Monday, and today it came quite near to the level of 1.2342, according to the hourly chart. The US dollar will once more benefit from

Samir Klishi 17:17 2023-03-28 UTC+2

USD/JPY: upside reversal

The USD/JPY pair is trading sideways in the short term between 129.74 and 131.73 levels. It has passed above the downtrend line which represents an upside obstacle

Ralph Shedler 16:43 2023-03-28 UTC+2

USD/CAD: downside continuation below 1.3634

USD/CAD is trading at 1.3658 at the time of writing. It is trading somehow sideways in the short term after dropping below the uptrend line

Ralph Shedler 16:40 2023-03-28 UTC+2

Trading Signal for USD/JPY for March 28 - 29, 2023: sell below 131.25 (4/8 Murray - bearish channel)

Early in the US session, the Japanese Yen is trading around 131.01, making a retracement after reaching a high of around 131.28, the level which coincides with 3/8 Murray (131.25)

Dimitrios Zappas 16:09 2023-03-28 UTC+2

Trading Signal for GOLD (XAU/USD) for March 28 - 29, 2023: buy above $1,957 (6/8 Murray - uptrend)

We can see that gold is trading within an uptrend channel formed since March 17. In case XAU/USD continues to trade above 1,937 (6/8 Murray), any technical correction could

Dimitrios Zappas 15:45 2023-03-28 UTC+2

Video market update for March 28, 2023

Potential for the upside move on crude

Petar Jacimovic 12:54 2023-03-28 UTC+2

Forex forecast 03/28/2023 AUD/USD, EUR/USD, USD/CAD and Gold from Sebastian Seliga

Let's take a look at the technical picture of AUD/USD, EUR/USD, USD/CAD and Gold

Sebastian Seliga 10:51 2023-03-28 UTC+2

Indicator analysis: Daily review of GBP/USD on March 28, 2023

The pound-dollar pair may move upward from the level of 1.2282 (closing of yesterday's daily candle) to test 1.2352, the 85.4% pullback level (blue dotted line). When testing this level

Stefan Doll 09:57 2023-03-28 UTC+2

Indicator analysis: Daily review of EUR/USD on March 28, 2023

The euro-dollar pair may move upward from the level of 1.0796 (closing of yesterday's daily candle) to 1.0835, the 61.8% pullback level (red dotted line). Upon reaching this level, continued

Stefan Doll 09:46 2023-03-28 UTC+2
现在无法通话?
提出您的问题,用 在线帮助.