empty
 
 
07.12.2022 03:15 PM
GBPUSD Potential for Bearish Drop | 7th December 2022

This image is no longer relevant

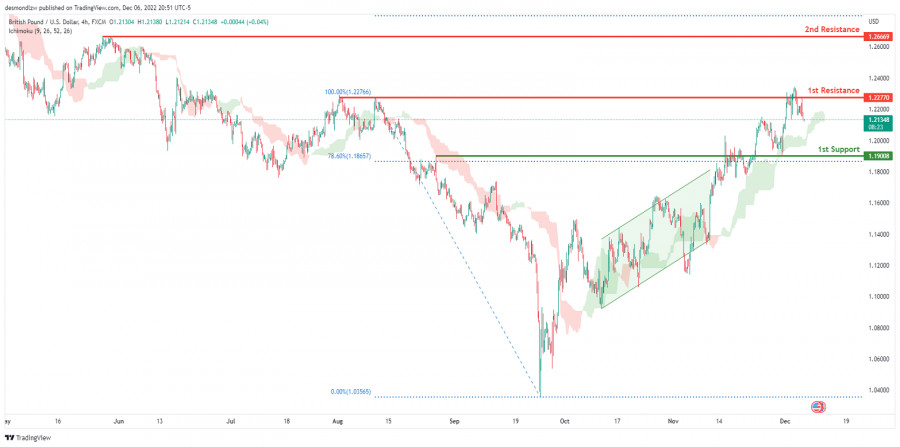
Looking at the H4 chart, my overall bias for GBPUSD is bullish due to the current price being above the Ichimoku cloud, indicating a bullish market. Expecting price to head back up to retest the 1st resistance line at 1.22770, where the previous high is. In an alternative scenario, price could possibly head back down towards the 1st support at 1.19008, where the 78.6% Fibonacci line is.

Trading Recommendation

Entry: 1.22770

Reason for Entry:

1st resistance line

Take Profit: 1.19008

Reason for Take Profit:1st support line

Stop Loss: 1.26669

Reason for Stop Loss:

2nd resistance line

Dean Leo,
Analytical expert of InstaForex
© 2007-2023
GBPUSD
Great Britain Pound vs US Dollar
Select timeframe
5
min
15
min
30
min
1
hour
4
hours
1
day
1
week
Start trade
Start trade
USDCHF, H4 | Potential Reversal 1st support ?
The USD/CHF chart currently shows bearish momentum towards the first support level at 0.9120, a strong swing low support level. A second support level is also present at 0.9059. On the upside, the first resistance level is at 0.9208, an overlap resistance level, with a potential retracement level..
作者: Dean Leo
02:12 2023-03-28 UTC--4
1075
NZDUSD, H4 | Continue to 1st Resistance?
The momentum of NZD/USD is bullish, with price above a major ascending trend line indicating potential for further bullish momentum. The first support level is at 0.6180, a swing low support, with the second support level at 0.6144 being an overlap support and significant Fibonacci retracement leve.
作者: Dean Leo
02:10 2023-03-28 UTC--4
1060
US500, H4 | Ascending trendline ?
US500 chart is bullish, with price above a major ascending trend line, potential for bullish continuation to first resistance. First support level at 3903.06 is a strong multi-swing low support, with second support at 3843.60. First resistance level at 4001.11 is a multi-swing high resistance, with.
作者: Dean Leo
02:04 2023-03-28 UTC--4
1030
展示更多
  • Grand Choice
    Contest by
    InstaForex
    InstaForex always strives to help you
    fulfill your biggest dreams.
    JOIN CONTEST
  • Chancy Deposit
    Deposit your account with $3,000 and get $8000 more!
    In March we raffle $8000 within the Chancy Deposit campaign!
    Get a chance to win by depositing $3,000 to a trading account. Having fulfilled this condition, you become a campaign participant.
    JOIN CONTEST
  • Trade Wise, Win Device
    Top up your account with at least $500, sign up for the contest, and get a chance to win mobile devices.
    JOIN CONTEST
  • 100% Bonus
    Your unique opportunity to get a 100% bonus on your deposit
    GET BONUS
  • 55% Bonus
    Apply for a 55% bonus on your every deposit
    GET BONUS
  • 30% Bonus
    Receive a 30% bonus every time you top up your account
    GET BONUS

Recommended Stories

Indicator analysis: Daily review of GBP/USD on March 28, 2023

The pound-dollar pair may move upward from the level of 1.2282 (closing of yesterday's daily candle) to test 1.2352, the 85.4% pullback level (blue dotted line). When testing this level

Stefan Doll 09:57 2023-03-28 UTC+2

Indicator analysis: Daily review of EUR/USD on March 28, 2023

The euro-dollar pair may move upward from the level of 1.0796 (closing of yesterday's daily candle) to 1.0835, the 61.8% pullback level (red dotted line). Upon reaching this level, continued

Stefan Doll 09:46 2023-03-28 UTC+2

Technical Analysis of GBP/USD for March 28, 2023

Technical Market Outlook: The GBP/USD pair has broken below the short-term trend line support and made a new local low at the level of 1.2189 and is currently moving

Sebastian Seliga 08:30 2023-03-28 UTC+2

Technical Analysis of EUR/USD for March 28, 2023

Technical Market Outlook: The EUR/USD pair has broken below the short-term trend line support (orange line on chart) and made a local low at the level of 1.0712. Since then

Sebastian Seliga 08:29 2023-03-28 UTC+2

Analysis of Gold for March 28,.2023 - Bear flag pattern and potential for the downside continuation

Technical analysis: Gold has been trading downside yesterday and I see potential for the downside continuation today. Due to the downside momentum in the background and the bear flag pattern

Petar Jacimovic 08:16 2023-03-28 UTC+2

Technical Analysis of Daily Price Movement of Silver Commodity Asset, Tuesday March 28, 2023.

After testing the 22,964 level which is a significant resistance level on the daily chart of Silver commodity assets, it seems that in the next few days Silver

Arief Makmur 08:13 2023-03-28 UTC+2

Technical Analysis of Daily Price Movement Nasdaq 100 Index, Tuesday March 28, 2023.

On the daily chart, the Nasdaq 100 index shows the emergence of the Rising Wedge pattern where this pattern gives an indication that in the next few days #NDX

Arief Makmur 08:13 2023-03-28 UTC+2

USDCHF, H4 | Potential Reversal 1st support ?

The USD/CHF chart currently shows bearish momentum towards the first support level at 0.9120, a strong swing low support level. A second support level is also present at 0.9059

Dean Leo 08:12 2023-03-28 UTC+2

NZDUSD, H4 | Continue to 1st Resistance?

The momentum of NZD/USD is bullish, with price above a major ascending trend line indicating potential for further bullish momentum. The first support level is at 0.6180, a swing

Dean Leo 08:10 2023-03-28 UTC+2

USD/CAD analysis for March 28, 2023 -Downside objective reached and potential for another drop

Technical analysis: USD/CAD has been trading downside as I expected. The price has reached the major downside objective at 1.3645 and there is chance for the further downside movement

Petar Jacimovic 08:07 2023-03-28 UTC+2
现在无法通话?
提出您的问题,用 在线帮助.