empty
 
 
26.01.2023 07:59 PM
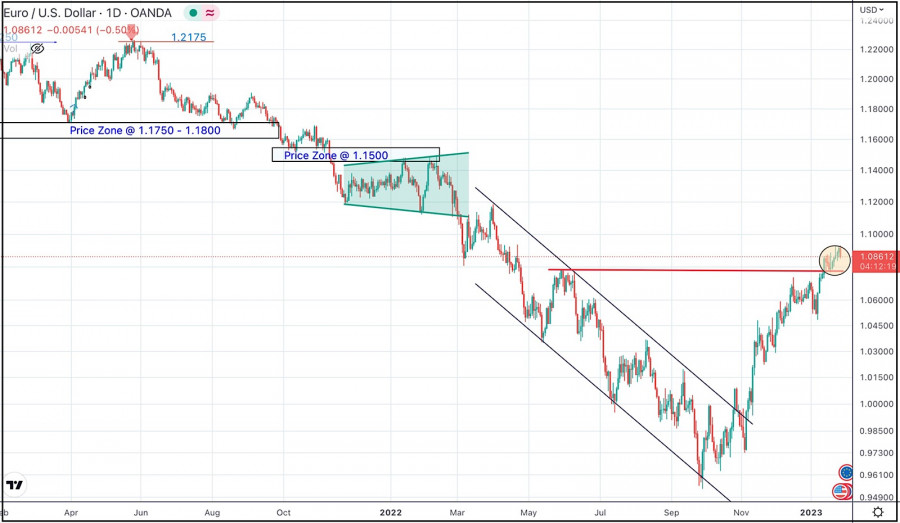
January 26, 2023 : EUR/USD daily technical review and trading opportunities.

This image is no longer relevant

The price zone around 1.1500 has applied significant SELLING pressure upon the previous ascending movement towards it.

Shortly after, the EUR/USD pair has been moving downwards reaching the price levels of 1.0850, 1.0400, 1.0000 and recently 0.9600.

The market has remained under buying pressure until a plateau level occurred around the key-zone around 1.0800-1.0750.

In the mean time, any downside movement towards 1.0300 should be watched for BUYING pressure where a new upside movement can be established.

Mohamed Samy,
Analytical expert of InstaForex
© 2007-2023
EURUSD
Euro vs US Dollar
Select timeframe
5
min
15
min
30
min
1
hour
4
hours
1
day
1
week
Start trade
Start trade
  • Grand Choice
    Contest by
    InstaForex
    InstaForex always strives to help you
    fulfill your biggest dreams.
    JOIN CONTEST
  • Chancy Deposit
    Deposit your account with $3,000 and get $8000 more!
    In March we raffle $8000 within the Chancy Deposit campaign!
    Get a chance to win by depositing $3,000 to a trading account. Having fulfilled this condition, you become a campaign participant.
    JOIN CONTEST
  • Trade Wise, Win Device
    Top up your account with at least $500, sign up for the contest, and get a chance to win mobile devices.
    JOIN CONTEST
  • 100% Bonus
    Your unique opportunity to get a 100% bonus on your deposit
    GET BONUS
  • 55% Bonus
    Apply for a 55% bonus on your every deposit
    GET BONUS
  • 30% Bonus
    Receive a 30% bonus every time you top up your account
    GET BONUS

Recommended Stories

Indicator analysis: Daily review of GBP/USD on March 30, 2023

The pound-dollar pair may move upward from the level of 1.2309 (closing of yesterday's daily candle) to 1.2360, the upper fractal (yellow dotted line). When testing this level, the price

Stefan Doll 09:56 2023-03-30 UTC+2

Indicator analysis: Daily review of EUR/USD on March 30, 2023

The euro-dollar pair may move upward from the level of 1.0843 (closing of yesterday's daily candle) to 1.0910, the 76.4% pullback level (red dotted line). From this level, the price

Stefan Doll 09:45 2023-03-30 UTC+2

Technical Analysis of GBP/USD for March 30, 2023

Technical Market Outlook: The GBP/USD pair has made another higher high at the level of 1.2360 as the up trend continues. The intraday technical support is seen at 1.2272 (50

Sebastian Seliga 08:28 2023-03-30 UTC+2

Technical Analysis of EUR/USD for March 30, 2023

Technical Market Outlook: The EUR/USD pair has tried to bounce higher and break through the last swing high at the level of 1.0930, but bulls were rejected from the intraday

Sebastian Seliga 08:27 2023-03-30 UTC+2

Analysis of Gold for March 30,.2023 - Key resistance in the play at $1.968

Technical analysis: Gold has been trading upside this morning and I can see that key resistance zone is set at hte price of $1.968. Pay attention to this level cause

Petar Jacimovic 08:23 2023-03-30 UTC+2

USD/CAD analysis for March 30, 2023 - First downside objective reached and potential for the further downside movement

Technical analysis: USD/CAD has been trading downside as I expected and the price reached first objective at 1.2560. Anyway, the sellers are in control and I see potential

Petar Jacimovic 08:15 2023-03-30 UTC+2

USDJPY, H4 | Potential Reversal from a key level?

The USD/JPY chart maintains a bearish momentum overall, indicating that the price could potentially react negatively to the first resistance level and drop towards the first support level. The first

Dean Leo 07:52 2023-03-30 UTC+2

GBPUSD, H4 | Continue to 1st Support?

The GBP/USD chart shows a bearish momentum, indicating the possibility of price continuing its decline towards the first support level. Presently, the price is testing the first resistance level

Dean Leo 07:51 2023-03-30 UTC+2

Technical Analysis of Daily Price Movement of Crude Oil Commodity Asset, Thursday March 30 2023.

On the daily chart, the Crude Oil commodity asset shows that the Stochastic Oscillator indicator is in a positive position and is also followed by the presence of the Bullish

Arief Makmur 07:36 2023-03-30 UTC+2

Technical Analysis of Intraday Price Movement of EUR/CHF Cross Currency Pairs, Thursday, March 30 2023.

Although on the 4 hour chart EUR/CHF cross currency pairs seems moving inside Bullish channel, but on the condition of Stochastic Oscillator indicator above the level 90 (Overbought) and ready

Arief Makmur 07:35 2023-03-30 UTC+2
现在无法通话?
提出您的问题,用 在线帮助.