empty
 
 
28.01.2023 07:53 PM
Technical analysis of EUR/USD for January 28, 2023

This image is no longer relevant

Review :

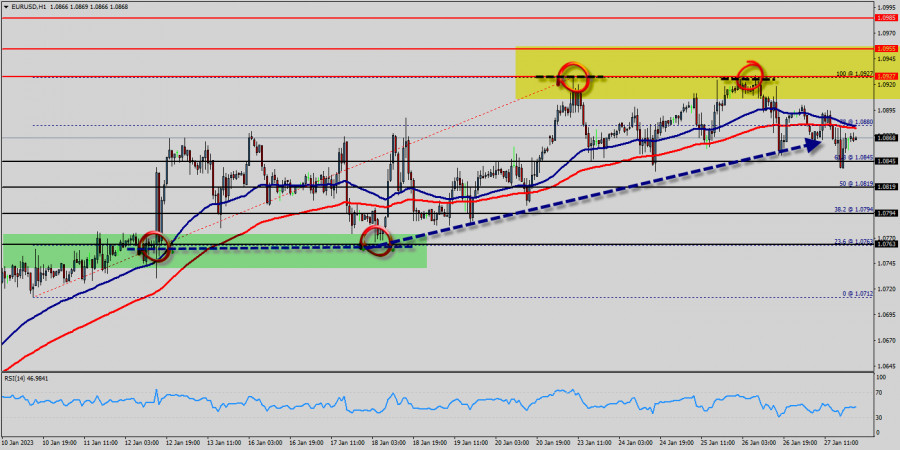
The bullish bias will be suggested for today, supported by the EMA100 that carries the price from above, taking into consideration that breaking 1.0819 will stop the expected rise and push the price back to the main bearish track again. A medium term topped could be in place already, on bullish convergence condition in daily RSI. Intraday bias is now on the upside for 61.8% retracement of 1.0819 to 1.0866 at 1.0880. The EUR/USD pair traded higher and closed the day in the positive territory around 1.0866. On the hourly chart, EUR/USD is still trading above the moving average line MA (100) H1 (1.0866). Accordingly, the bullish outlook remains the same as long as the EMA 100 is pointing to the uptrend. This suggests that the pair will probably go above the daily pivot point (1.0819) in the coming hours. The EUR/USD pair will demonstrate strength following a breakout of the high at 1.0866. The situation is similar on the one-hour chart. Based on the foregoing, it is probably worth sticking to the north direction in trading, and as long as the EUR/USD pair remains above MA100 H1, it may be necessary to look for entry points to buy for the formation of a correction. Probably, the main scenario is continued growth towards 1.0927. The expected trading range for today is between 1.0819 support and 1.0927 resistance.

The EUR/USD pair rallied upwards strongly yesterday to breach the bearish channel's resistance and settles above it, opening the way to turn to the upside on the intraday and short-term basis, starting bullish correction for the raise measured from 1.0819 to 1.0865, noting that the first main station is located at 1.0927, which breaching it represents the key to achieve additional gains that reach 1.0927.

According to the previous events, the EUR/USD pair is still trading between the levels of 1.0845 and 1.0927. Hence, we expect a range of 82 pips in coming hours (1.0927 - 1.0845). The first resistance stands at the price of 1.0927, therefore if the EUR/USD pair succeeds to break through the resistance level of 1.0927, the market will rise further to 1.0955.

This would suggest a bullish market because the RSI indicator is still in a positive area and does not show any trend-reversal signs. The pair is expected to rise higher towards at least 1.0955 in order to test the second resistance (1.0985). The US Dollar and the Euro are two of the most prominent and well-known currencies in the world. The Euro versus US Dollar (EUR/USD) currency pair has the largest global trading volume, meaning it is the world's most-traded currency pair. Whether you find the instrument easy or difficult to trade on, it's not a pair that many traders neglect, due to its daily volatility and price movement.

Thus, the market is indicating a bearish opportunity above the above-mentioned support levels, for that the bullish outlook remains the same as long as the 100 EMA is headed to the upside. Today, support is seen at the levels of 1.0845 and 1.0819. So, we expect the price to set above the strong support at the levels of 1.0845 and 1.0819; because the price is in a bullish channel now.

The RSI starts signaling upward trend. Consequently, the market is likely to show signs of a bullish trend. Thus, it will be good to buy above the level of 1.0845 with the first target at 1.0927 and further to 1.0955 in order to test the daily resistance. If the EUR/USD pair is able to break out the daily resistance at 1.0955 , the market will rise further to 1.0985 to approach support 3 in coming hours or two days. However, the price spot of 1.0985 and 1.0955 remains a significant resistance zone. Therefore, the trend is still bullish as long as the level of 1.0845 is not breached.

EURUSD
Euro vs US Dollar
Select timeframe
5
min
15
min
30
min
1
hour
4
hours
1
day
1
week
Start trade
Start trade
  • Grand Choice
    Contest by
    InstaForex
    InstaForex always strives to help you
    fulfill your biggest dreams.
    JOIN CONTEST
  • Chancy Deposit
    Deposit your account with $3,000 and get $8000 more!
    In March we raffle $8000 within the Chancy Deposit campaign!
    Get a chance to win by depositing $3,000 to a trading account. Having fulfilled this condition, you become a campaign participant.
    JOIN CONTEST
  • Trade Wise, Win Device
    Top up your account with at least $500, sign up for the contest, and get a chance to win mobile devices.
    JOIN CONTEST
  • 100% Bonus
    Your unique opportunity to get a 100% bonus on your deposit
    GET BONUS
  • 55% Bonus
    Apply for a 55% bonus on your every deposit
    GET BONUS
  • 30% Bonus
    Receive a 30% bonus every time you top up your account
    GET BONUS

Recommended Stories

NZDUSD, H4 | Potential Bearish Reversal

The NZD/USD chart currently displays a bearish momentum, with price below a major descending trend line and the bearish Ichimoku cloud. The potential price movement could involve a bearish reaction

Dean Leo 09:46 2023-03-20 UTC+2

XAUUSD, Day | Potential Bearish Reversal from?

Gold prices have been experiencing a bearish trend for some time now, which is reinforced by a major descending trend line on the XAU/USD chart. The current price could potentially

Dean Leo 09:45 2023-03-20 UTC+2

Analysis of Gold for March 20,.2023 - Extreme bullish condiiton, potential for the further upside movement

Technical analysis: Gold has been trading upside this morning and I found that Gold is the very strong upside momentum and there is the chance for the multi year highs

Petar Jacimovic 09:25 2023-03-20 UTC+2

USD/CHF analysis for March 20, 2023 - Breakout of the triangle pattern to the upside

Technical analysis: USD/CHF has been trading upside this morning and I found the breakout of the triangle pattern in the background. Due to the breakout of the tight triangle

Petar Jacimovic 09:18 2023-03-20 UTC+2

Indicator analysis: Daily review of GBP/USD on March 20, 2023

The pound-dollar pair may move upward from the level of 1.2176 (closing of Friday's daily candle) to 1.2273, the 76.4% pullback level (blue dotted line). Upon reaching this level

Stefan Doll 09:17 2023-03-20 UTC+2

Indicator analysis: Daily review of EUR/USD on March 20, 2023

The euro-dollar pair may move upward from the level of 1.0666 (closing of Friday's daily candle) to 1.0713, the 38.2% pullback level (red dotted line). When testing this level

Stefan Doll 09:05 2023-03-20 UTC+2

Technical Analysis of GBP/USD for March 20, 2023

Technical Market Outlook: The GBP/USD pair has been seen testing the last swing high located at the level of 1.2202. The bulls had violated the level of 1.2135 which

Sebastian Seliga 08:45 2023-03-20 UTC+2

Technical Analysis of EUR/USD for March 20, 2023

Technical Market Outlook: The EUR/USD pair has been seen moving up towards the last swing high located at 1.0760 and the recent local high was made at the level

Sebastian Seliga 08:45 2023-03-20 UTC+2

Technical analysis of GBP/USD for March 20-26, 2023

GBP/USD may continue an upward movement this week, starting from the closing of last week's candle to the upper fractal. Upon testing this level, the pair will head towards

Stefan Doll 08:36 2023-03-20 UTC+2

Technical analysis of EUR/USD for March 20-26, 2023

EUR/USD is likely to continue its upward movement this week, rising from the closing of the last weekly candle to the 50.0% retracement level. Upon reaching this price, the pair

Stefan Doll 08:34 2023-03-20 UTC+2
现在无法通话?
提出您的问题,用 在线帮助.