empty
 
 
30.01.2023 10:03 PM
Technical analysis of GBP/USD for January 30, 2023

This image is no longer relevant

Overview:

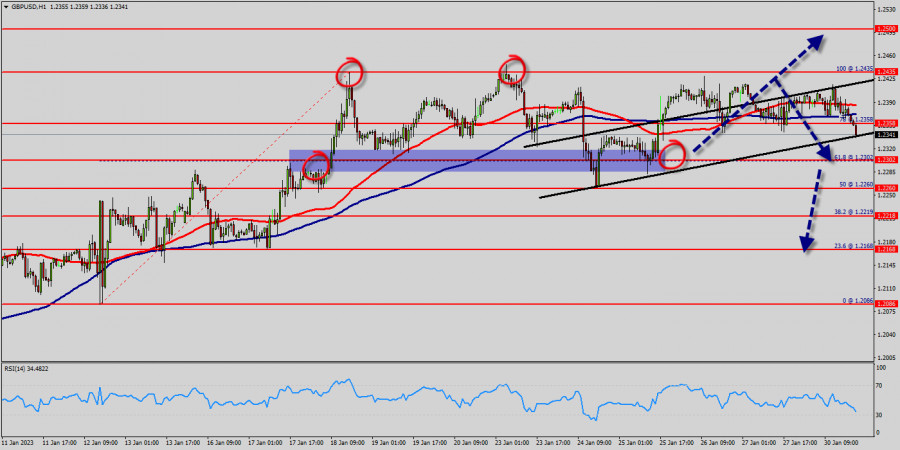
The GBP/USD pair broke resistance which turned to strong support at the level of 1.2302 yesterday. The level of 1.2302 coincides with a golden ratio (61.8% of Fibonacci), which is expected to act as major support today. The Relative Strength Index (RSI) is considered overbought because it is above 35. The RSI is still signaling that the trend is upward as it is still strong above the moving average (100).

This suggests the pair will probably go up in coming hours. This support has been rejected for three times confirming uptrend veracity. Hence, major support is seen at the level of 1.2302 because the trend is still showing strength above it.

The Relative Strength Index (RSI) is considered oversold because it is above 35. At the same time, the RSI is still signaling an upward trend, as the trend is still showing strong above the moving average (100), this suggests the pair will probably go up in coming hours. Accordingly, the market is likely to show signs of a bullish trend. In other words, buy orders are recommended above 1.2302 with the first target at the level of 1.2358.

From this point, the pair is likely to begin an ascending movement to the point of 1.2358 and further to the level of 1.2435.

The level of 1.2435 will act as strong resistance and the double top is already set at the point of 1.2435.

On the other hand, if a breakout happens at the support level of 1.2302, then this scenario may become invalidated.

Conclusion :

We should see the pair climbing towards the next target of 1.2435. The pair will move upwards continuing the development of the bullish trend to the level 1.2435 and 1.2500 in coming days. On the other hand, in case a reversal takes place and the GBP/USD pair breaks through the support level of 1.2302, a further decline to 1.2260 can occur. It would indicate a bearish market.

GBPUSD
Great Britain Pound vs US Dollar
Select timeframe
5
min
15
min
30
min
1
hour
4
hours
1
day
1
week
Start trade
Start trade
  • Grand Choice
    Contest by
    InstaForex
    InstaForex always strives to help you
    fulfill your biggest dreams.
    JOIN CONTEST
  • Chancy Deposit
    Deposit your account with $3,000 and get $8000 more!
    In March we raffle $8000 within the Chancy Deposit campaign!
    Get a chance to win by depositing $3,000 to a trading account. Having fulfilled this condition, you become a campaign participant.
    JOIN CONTEST
  • Trade Wise, Win Device
    Top up your account with at least $500, sign up for the contest, and get a chance to win mobile devices.
    JOIN CONTEST
  • 100% Bonus
    Your unique opportunity to get a 100% bonus on your deposit
    GET BONUS
  • 55% Bonus
    Apply for a 55% bonus on your every deposit
    GET BONUS
  • 30% Bonus
    Receive a 30% bonus every time you top up your account
    GET BONUS

Recommended Stories

Trading Signal for GBP/USD for March 22 - 23, 2023: key level 1.2217 (4/8 Murray - symmetrical triangle)

The key level is located around 1.2217 and around 1.2207. If the British pound breaks both levels and consolidates below the 4/8 Murray, we could expect a strong technical correction

Dimitrios Zappas 15:54 2023-03-22 UTC+2

Technical analysis on Gold for March 22nd, 2023.

Gold price is under pressure. Trend is still bullish as price continues trading inside the blue upward sloping channel. In the near term price is vulnerable to a pull back

Alexandros Yfantis 14:18 2023-03-22 UTC+2

Technical analysis on EURUSD for March 22nd, 2023.

EURUSD is trading around 1.0785. Short-term trend remains bullish a price continues making higher highs and higher lows. Price is inside the upward sloping blue channel and is approaching

Alexandros Yfantis 14:08 2023-03-22 UTC+2

USDJPY breaks out of bearish short-term channel.

USDJPY is trading around 132.82. As we explained in previous posts, USDJPY was very probable to produce a bounce higher as price stopped the decline at the 61.8% retracement level

Alexandros Yfantis 14:05 2023-03-22 UTC+2

March 22, 2023 : EUR/USD daily technical review and trading opportunities.

The market has remained under buying pressure until a plateau level occurred around 1.0800-1.0850. This was followed by a significant SELLING price action leading to the recent price decline

Mohamed Samy 13:20 2023-03-22 UTC+2

March 22, 2023 : EUR/USD Intraday technical analysis and trading plan.

Price action around the key-level of (1.0550-1.0600) was quite bullish. That's why, further bullish continuation towards 1.0800 was demonstrated. Moreover, more bullish advancement towards the nearest supply zone around 1.1150-1.1200

Mohamed Samy 13:18 2023-03-22 UTC+2

March 22, 2023 : GBP/USD Intraday technical analysis and significant key-levels.

Please take into consideration that bullish breakout above 1.2340 will probably enable further advancement towards 1.2700. However, the GBPUSD bulls failed to record a new high above 1.2200. Instead

Mohamed Samy 13:17 2023-03-22 UTC+2

Analysis of EUR/USD on March 22. EUR likely to decline after Fed meeting

Hi everyone! The EUR/USD pair rose above 1.0750 on Tuesday. It may approach 1.0861, the Fibonacci correction level of 200.0%. The upward corridor indicates a bullish sentiment. However

Samir Klishi 11:17 2023-03-22 UTC+2

GBP/USD forecast for March 22, 2023. UK inflation data disappoints traders

Yesterday, the GBP/USD pair reversed on the 1-hour chart and began to decline towards the lower line of the ascending trend channel. However, it failed to reach the target

Samir Klishi 11:03 2023-03-22 UTC+2

Video market update for March 22, 2023

Potential for the upside continuation on the USD/JPY

Petar Jacimovic 09:37 2023-03-22 UTC+2
现在无法通话?
提出您的问题,用 在线帮助.