empty
 
 
03.02.2023 09:23 AM
BTCUSD Potential For Bullish Rise to previous swing high

This image is no longer relevant

Description :

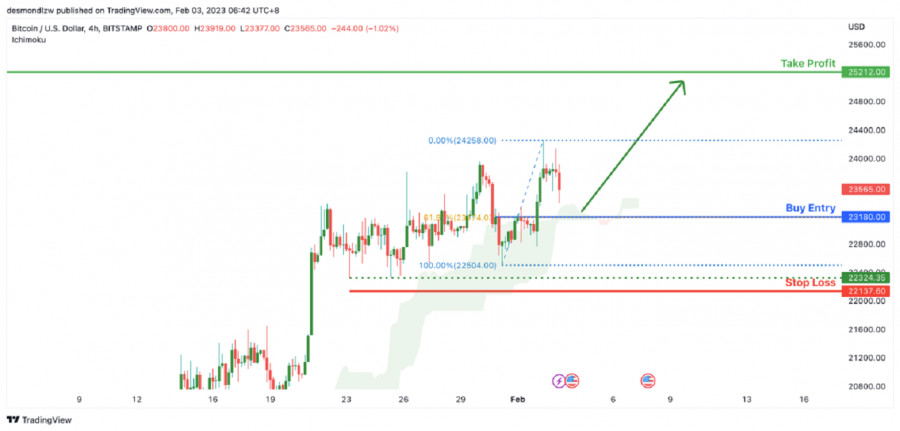
Looking at the H4 chart, my overall bias for BTCUSD is bullish due to the current price being above the Ichimoku cloud, indicating a bullish market.

Looking for a pullback buy entry at 23180.00, where the overlap support and 61.8% Fibonacci line is. Stop loss will be at 22137.60, slightly below where the intermediary support is. Take profit will be at 25212.00, where the previous swing high was.

Trading Recommendation

Entry: 23180.00

Reason for Entry: Retest overlap support and 61,8% Fibonacci line

Take Profit:25212.00

Reason for Take Profit: Previous swing high

Stop Loss: 22137.60

Reason for Stop Loss:

Slightly below where the intermediary support

Dean Leo,
Analytical expert of InstaForex
© 2007-2023
EURUSD
Euro vs US Dollar
Select timeframe
5
min
15
min
30
min
1
hour
4
hours
1
day
1
week
Start trade
Start trade
NZDUSD, H4 | Potential Bearish Reversal
The NZD/USD chart currently displays a bearish momentum, with price below a major descending trend line and the bearish Ichimoku cloud. The potential price movement could involve a bearish reaction off the 1st resistance, leading to a drop towards the 1st support level. At 0.6097, the 1st support.
作者: Dean Leo
04:46 2023-03-20 UTC--4
1900
XAUUSD, Day | Potential Bearish Reversal from?
Gold prices have been experiencing a bearish trend for some time now, which is reinforced by a major descending trend line on the XAU/USD chart. The current price could potentially move between the first support and resistance levels. The first support level is a multi-swing low support at 1881, wh.
作者: Dean Leo
04:45 2023-03-20 UTC--4
1885
EURUSD, Day | Potential reversel?
The EUR/USD pair has bullish momentum and may move towards the 1st resistance level. Pullback support at 1.0478, coinciding with the 38.20% Fibonacci retracement level, is currently supporting the price. If the price bounces from this support, it could reach the 1st resistance level at 1.1001, a si.
作者: Dean Leo
04:44 2023-03-20 UTC--4
1930
展示更多
  • Grand Choice
    Contest by
    InstaForex
    InstaForex always strives to help you
    fulfill your biggest dreams.
    JOIN CONTEST
  • Chancy Deposit
    Deposit your account with $3,000 and get $8000 more!
    In March we raffle $8000 within the Chancy Deposit campaign!
    Get a chance to win by depositing $3,000 to a trading account. Having fulfilled this condition, you become a campaign participant.
    JOIN CONTEST
  • Trade Wise, Win Device
    Top up your account with at least $500, sign up for the contest, and get a chance to win mobile devices.
    JOIN CONTEST
  • 100% Bonus
    Your unique opportunity to get a 100% bonus on your deposit
    GET BONUS
  • 55% Bonus
    Apply for a 55% bonus on your every deposit
    GET BONUS
  • 30% Bonus
    Receive a 30% bonus every time you top up your account
    GET BONUS

Recommended Stories

March 20, 2023 : EUR/USD daily technical review and trading opportunities.

The market has remained under buying pressure until a plateau level occurred around 1.0800-1.0850. This was followed by a significant SELLING price action leading to the recent price decline

Mohamed Samy 18:51 2023-03-20 UTC+2

March 20, 2023 : EUR/USD Intraday technical analysis and trading plan.

Price action around the key-level of (1.0550-1.0600) was quite bullish. That's why, further bullish continuation towards 1.0800 was demonstrated. Moreover, more bullish advancement towards the nearest supply zone around 1.1150-1.1200

Mohamed Samy 18:50 2023-03-20 UTC+2

March 20, 2023 : GBP/USD Intraday technical analysis and significant key-levels.

The GBPUSD bulls failed to record a new high above 1.2200. Instead, a descending high was established around the same price level. On the other hand, the current bearish pullback

Mohamed Samy 18:49 2023-03-20 UTC+2

Increased chances for upward reversal in USDJPY.

USDJPY is trading around 131.60. Short-term trend remains bearish. Price continues making lower lows and lower highs. Price is still inside the downward sloping red channel. As long as this

Alexandros Yfantis 17:01 2023-03-20 UTC+2

NZDUSD rejection at neckline resistance

In a previous analysis we noted the inverted head and shoulders pattern in NZDUSD. Price tried to break above the neckline resistance and activate the inverted head and shoulders pattern

Alexandros Yfantis 16:56 2023-03-20 UTC+2

Technical analysis on Gold for March 20th, 2023.

Gold price is trading around $1,969. After briefly reaching as high as $2,009 Gold price has started to turn around. Price continues making higher highs and higher lows. Price remains

Alexandros Yfantis 16:36 2023-03-20 UTC+2

EURUSD inside expanding triangle pattern

EURUSD is trading around 1.0720. Despite making a new lower low at 1.0517 last week, price has bounced and is now challenging recent highs. Price has formed an expanding triangle

Alexandros Yfantis 16:32 2023-03-20 UTC+2

Trading Signal for USD/JPY for March 20 - 21, 2023: buy above 131.11 (4/8 Murray - descending wedge )

Early in the American session, the Japanese Yen is trading at 131.11 below the 4/8 Murray and below the 21 SMA (131.79). In the European session, the instrument reached

Dimitrios Zappas 16:32 2023-03-20 UTC+2

Technical analysis of GBP/USD for March 20, 2023

The GBP/USD pair traded higher and closed the day in the positive territory near the price of 1.2208. Right now, it was trading in a narrow range of 1.2150 staying

Mourad El Keddani 13:04 2023-03-20 UTC+2

Forex forecast 03/20/2023 EUR/USD, USD/JPY, GBP/USD, Gold and Bitcoin from Sebastian Seliga

Let's take a look at the technical picture of EUR/USD, USD/JPY, GBP/USD, Gold and Bitcoin

Sebastian Seliga 12:48 2023-03-20 UTC+2
现在无法通话?
提出您的问题,用 在线帮助.