empty
 
 
09.02.2023 10:04 AM
AUDCAD Potential for Bearish Drop towards overlap support

This image is no longer relevant

Description :

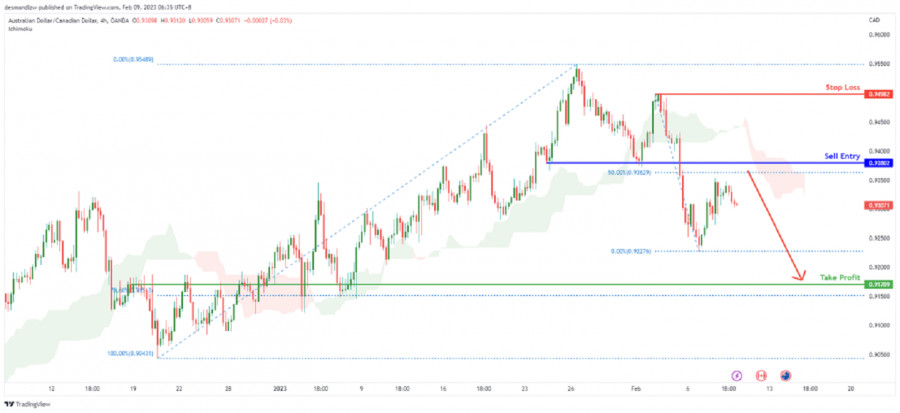
Looking at the H4 chart, my overall bias for AUDCAD is bearish due to the current price being below the Ichimoku cloud, indicating a bearish market. Looking for a pullback sell entry at 0.93802, where the overlap resistance and 50% Fibonacci line is. Stop loss will be at 0.94982, where the recent swing high is. Take profit will be at 0.91709, where the overlap support and 78.6% Fibonacci line is.

Trading Recommendation

Entry: 0.93802

Reason for Entry: overlap resistance and 50% Fibonacci line

Take Profit: 0.91709

Reason for Take Profit:

Previous swing high

Dean Leo,
Analytical expert of InstaForex
© 2007-2023
AUDCAD
Australian Dollar vs Canadian Dollar
Select timeframe
5
min
15
min
30
min
1
hour
4
hours
1
day
1
week
Start trade
Start trade
USDCHF, H4 | Potential Reversal 1st support ?
The USD/CHF chart currently shows bearish momentum towards the first support level at 0.9120, a strong swing low support level. A second support level is also present at 0.9059. On the upside, the first resistance level is at 0.9208, an overlap resistance level, with a potential retracement level..
作者: Dean Leo
02:12 2023-03-28 UTC--4
2365
NZDUSD, H4 | Continue to 1st Resistance?
The momentum of NZD/USD is bullish, with price above a major ascending trend line indicating potential for further bullish momentum. The first support level is at 0.6180, a swing low support, with the second support level at 0.6144 being an overlap support and significant Fibonacci retracement leve.
作者: Dean Leo
02:10 2023-03-28 UTC--4
2410
US500, H4 | Ascending trendline ?
US500 chart is bullish, with price above a major ascending trend line, potential for bullish continuation to first resistance. First support level at 3903.06 is a strong multi-swing low support, with second support at 3843.60. First resistance level at 4001.11 is a multi-swing high resistance, with.
作者: Dean Leo
02:04 2023-03-28 UTC--4
1765
展示更多
  • Grand Choice
    Contest by
    InstaForex
    InstaForex always strives to help you
    fulfill your biggest dreams.
    JOIN CONTEST
  • Chancy Deposit
    Deposit your account with $3,000 and get $8000 more!
    In March we raffle $8000 within the Chancy Deposit campaign!
    Get a chance to win by depositing $3,000 to a trading account. Having fulfilled this condition, you become a campaign participant.
    JOIN CONTEST
  • Trade Wise, Win Device
    Top up your account with at least $500, sign up for the contest, and get a chance to win mobile devices.
    JOIN CONTEST
  • 100% Bonus
    Your unique opportunity to get a 100% bonus on your deposit
    GET BONUS
  • 55% Bonus
    Apply for a 55% bonus on your every deposit
    GET BONUS
  • 30% Bonus
    Receive a 30% bonus every time you top up your account
    GET BONUS

Recommended Stories

US500, H4 | Ascending trendline ?

US500 chart is bullish, with price above a major ascending trend line, potential for bullish continuation to first resistance. First support level at 3903.06 is a strong multi-swing low support

Dean Leo 08:04 2023-03-28 UTC+2

WIT(OIL), Day | Strong descending trendline ?

WTI oil prices have turned bearish as they fell below a crucial support level. The chart indicates that the momentum has shifted to the downside, signaling a potential further decline

Dean Leo 07:46 2023-03-27 UTC+2

USDJPY, H4 | Strong descending trendline ?

The USD/JPY pair currently has a weak momentum with low confidence due to its position below a major descending trend line, indicating possible bearish momentum. Breaking off from the first

Dean Leo 06:07 2023-03-24 UTC+2

USDCAD, H4 | Respected descending trendline ?

The charts indicate that the USD/CAD currency pair is currently experiencing a bearish momentum, with price situated below a significant descending trend line. As such, it is likely that

Dean Leo 06:55 2023-03-23 UTC+2

USD/JPY, H4 | Break out trendline?

The USD/JPY chart currently reflects a bullish momentum as it is trading above a significant ascending trend line, indicating potential for further bullish movement. In case the price manages

Dean Leo 06:37 2023-03-22 UTC+2

AUDUSD, H4 | Break out trendline?

Currently, the AUD/USD chart reflects bullish momentum, indicated by the break above a descending resistance line and the crossing above the Ichimoku cloud. The potential for continued bullish movement towards

Dean Leo 07:53 2023-03-21 UTC+2

EURUSD, Day | Potential reversel?

The EUR/USD pair has bullish momentum and may move towards the 1st resistance level. Pullback support at 1.0478, coinciding with the 38.20% Fibonacci retracement level, is currently supporting the price

Dean Leo 09:44 2023-03-20 UTC+2

GBPUSD, H4 | Potential reversel from trendline?

The GBP/USD chart currently exhibits bearish momentum, as the price remains below a significant descending trend line. This indicates that the currency pair may undergo further downward pressure

Dean Leo 08:05 2023-03-17 UTC+2

AUDUSD, H4 | Potential reversel from trendline?

Price is approaching our 1st resistance level at 0.6694 along with a 61.8% Fibonacci retracement. If the price were to break above, it could push up to 2nd resistance

Dean Leo 10:10 2023-03-16 UTC+2

USDJPY, H1 | Time to Buy?

The price has recently reversed from our 1st resistance level at 135.18, which lines up with the 50% Fibonacci retracement. Additionally, it appears that the price has broken through

Dean Leo 19:39 2023-03-15 UTC+2
现在无法通话?
提出您的问题,用 在线帮助.