Details of the economic calendar for August 3
Services PMI and composite index figures for Europe, the UK, and the United States, came out with broad declines. This did not surprise the market given that the preliminary assessment has already reflected a decline in indicators.
Statistics details:
In Europe, the index of business activity in the service sector fell from 53.0 to 51.2 points, while the forecast was 50.6 points. The composite index fell from 52.0 to 49.9 points.
In the UK, the situation is slightly worse. Services PMI fell from 54.3 to 52.6 points, with a forecast of a decline to 53.3 points. The composite index fell from 53.7 to 52.1 points.
Services PMI in the US fell from 52.7 to 47.3 points, with a forecast of a fall to 47.0 points. As a result, the composite index fell from 52.3 to 47.7 points.
The market, in turn, increased the volume of dollar positions.
Analysis of trading charts from August 3
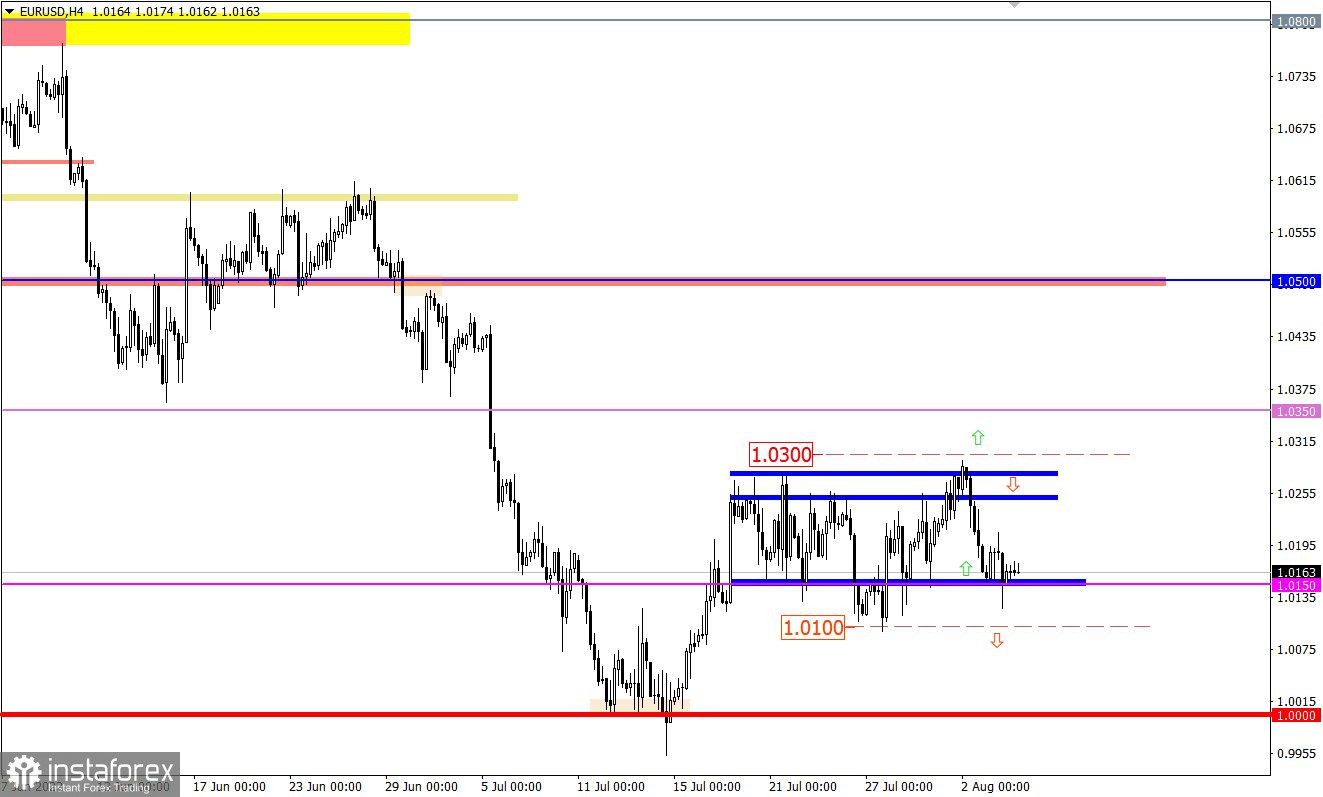
The EURUSD currency pair slowed down activity within the lower border of the side channel 1.0150/1.0270. As a result, a consolidation move arose from versatile candles of the "Doji" type. The current stop can serve as a process of accumulation of trading forces, which will eventually lead to a new round of acceleration in the market.
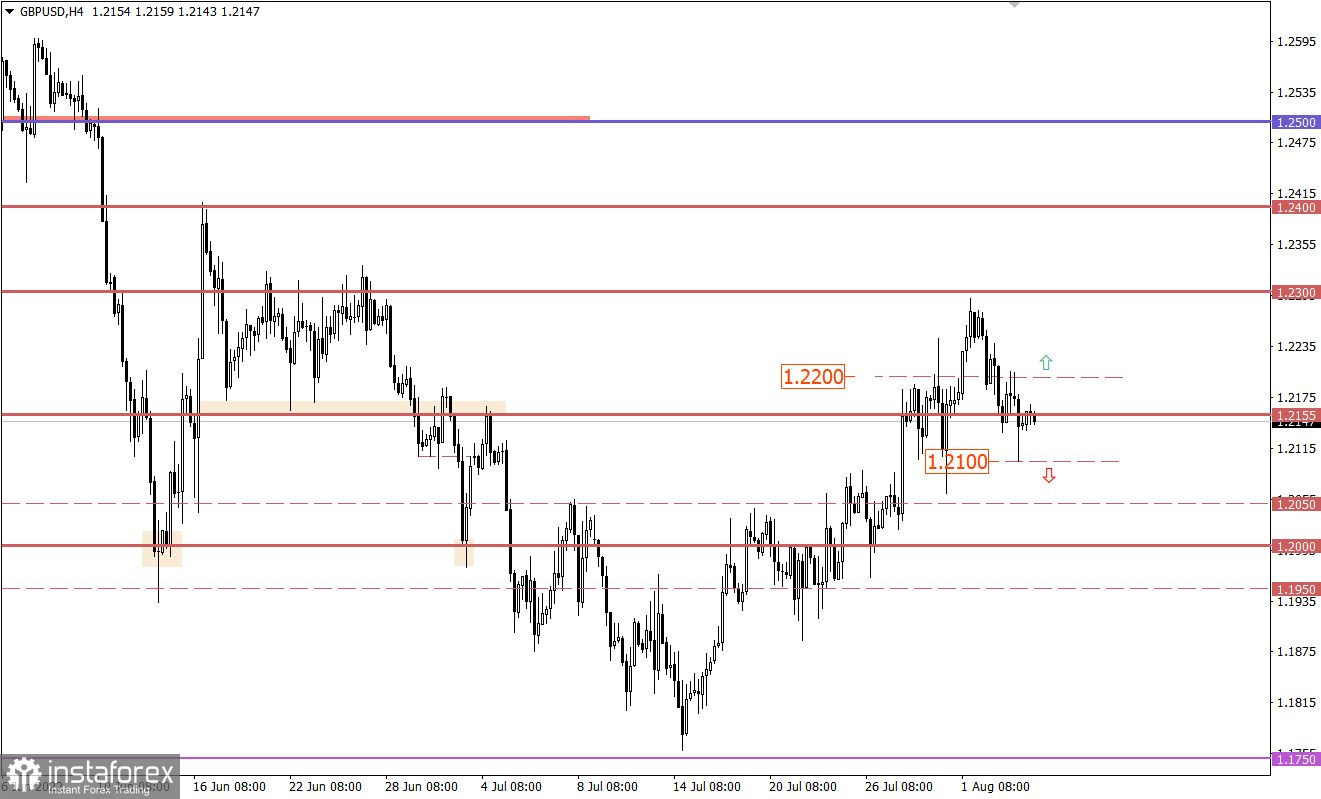
The GBPUSD currency pair fell below 1.2155 at the stage of restoring short positions relative to the recent corrective move. The level of 1.2300 serves as resistance, where a change in trading interests has occurred.
Economic calendar for August 4
Today, the focus is on the results of the meeting of the Bank of England, where the regulator intends to carry out a more aggressive increase in rates. Forecasts from the Bank of England said they are waiting for a rate increase by 50 basis points at once, to 1.75%.
It is worth noting that the Bank of England has never raised the rate by 0.5% since it gained independence in 1997.
We are on the verge of a historical event that may well have an impact on the market.
The work should also consider the subsequent press conference with BoE Governor Andrew Bailey, as his comments will have a significant role for the subsequent movement.
After the results of the meeting of the Bank of England, data on jobless claims in the United States, will be published. This is a negative factor for the US labor market.
Statistics details:
Continuing claims for benefits may be reduced from 1.359 million to 1.370 Million.
Initial claims for benefits may increase from 256,000 to 259,000.
Time targeting:
Bank of England Meeting Result – 11:00 UTC
Bank of England Governor Andrew Bailey Speech – 11:30 UTC
US Jobless Claims – 12:30 UTC
Trading plan for EUR/USD on August 4
A long-term strategy in the form of a price rebound from the flat border is still relevant in the market, despite the fact that the side channel is already at the stage of possible completion.
The main strategy will be the exit of the price from the flat, where the sell signal will be relevant if the price holds below the value of 1.0100 in a four-hour period. The descending scenario will lead to another touch of the parity level.
As for a prolonged correction, the quote must return to the flat's upper border and then fix above the value of 1.0300. That is, with this development of the market, the rebound method will be able to build another cycle, during which traders will start discussing the signal about the prolongation of the correction.
Trading plan for GBP/USD on August 4
The concentration of trading forces within the level of 1.2155 is a temporary manifestation in the market. In view of the upcoming results of the meeting of the Bank of England, speculative activity is expected, which, as a result, may indicate the main price movement on the market.
From the point of view of technical analysis, the most optimal point for considering long positions is 1.2200. While the subsequent downward cycle is possible after holding the price below the values of 1.2100/1.2120 in a four-hour period.
What is reflected in the trading charts?
A candlestick chart view is graphical rectangles of white and black light, with sticks on top and bottom. When analyzing each candle in detail, you will see its characteristics of a relative period: the opening price, closing price, and maximum and minimum prices.
Horizontal levels are price coordinates, relative to which a stop or a price reversal may occur. These levels are called support and resistance in the market.
Circles and rectangles are highlighted examples where the price of the story unfolded. This color selection indicates horizontal lines that may put pressure on the quote in the future.
The up/down arrows are the reference points of the possible price direction in the future.