empty
 
 
14.11.2022 04:22 PM
EUR/USD analysis on November 14, 2022

This image is no longer relevant

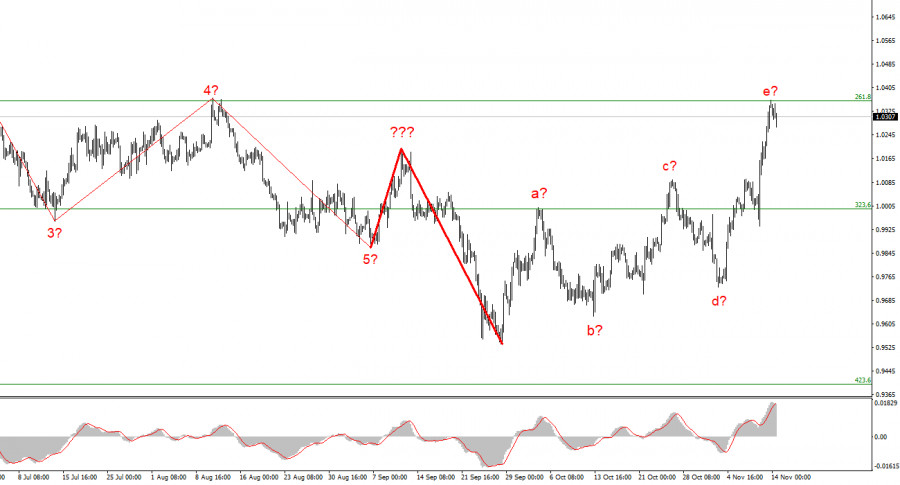
The wave marking of the 4-hour chart for the euro/dollar instrument has undergone certain changes. The upward section of the trend continues its construction, but now it takes on a pronounced corrective form. Initially, I thought that three waves would be built up, but now it is obvious that there are five waves. Thus, we get a complex correction structure of waves a-b-c-d-e. If this assumption is correct, then the construction of this structure may be nearing its completion since the peak of wave e exceeds the peak of wave C. In this case, we are expected to build at least three waves, but if the last section of the trend is corrective, then the next one will most likely be impulsive. Therefore, I am preparing for a new, strong decline in the instrument. An unsuccessful attempt to break through the 1.0359 mark, corresponding to 261.8% Fibonacci, will indicate the market's readiness to sell.

The most important thing now is that the wave markings of the pound and the euro coincide. If you remember, I have repeatedly warned about the low probability of a scenario in which the euro and the pound will trade in different directions. Theoretically, this is certainly possible, but it rarely happens in practice. Now both instruments are presumably building corrective trend sections, which may be completed in the near future. Thus, the British dollar may also begin to decline within the framework of a new downward trend segment.

Has the time of the euro currency passed or not yet?

The euro/dollar instrument fell by 35 basis points on Monday. It is strange, but today I did not see a strong decrease in demand for the instrument, although such a scenario suggested itself after last week when the increase was several hundred points. Let me remind you that last week, not only the report on US inflation caused panic in the foreign exchange market but also several speeches by FOMC members, who hinted with all their might that the Fed would begin to slow down the pace of rate hikes in the near future. Together, these two factors caused a strong decline in demand for the US currency. However, a new week has begun, and the market needs new growth or decline factors.

Currently, the wave pattern for the euro currency is close to ideal. Five upward correction waves were built, so at least a three-wave downward correction structure should be built. An unsuccessful attempt to break through the level of 261.8% indirectly indicates the readiness of the market for sales. However, as I have already said, the instrument practically stayed the same on Monday. The day is certainly still ongoing, but a successful attempt to break the 1.0359 mark will announce that the market is buying again. Today's only event was the release of the September report on industrial production in the European Union. Its value is 0.9% mom and 4.9% y/y. The market expected a weaker value but, at the same time, did not react to it in any way. The increase in quotations began later and looks very dangerous for the current wave markup. If the high demand for the euro continues, this may lead to a complication of the already upward trend section, which has recently begun.

This image is no longer relevant

General conclusions.

Based on the analysis, the construction of the upward trend section has become more complicated, consisting of five waves. It continues due to the inflation report and impartial statements by FOMC members. However, I cannot advise buying now since the wave marking still needs to imply a further increase. I recommend selling in case of an unsuccessful attempt to break through the 1.0359 mark with targets located near the estimated 0.9994 mark, which corresponds to 323.6% Fibonacci.

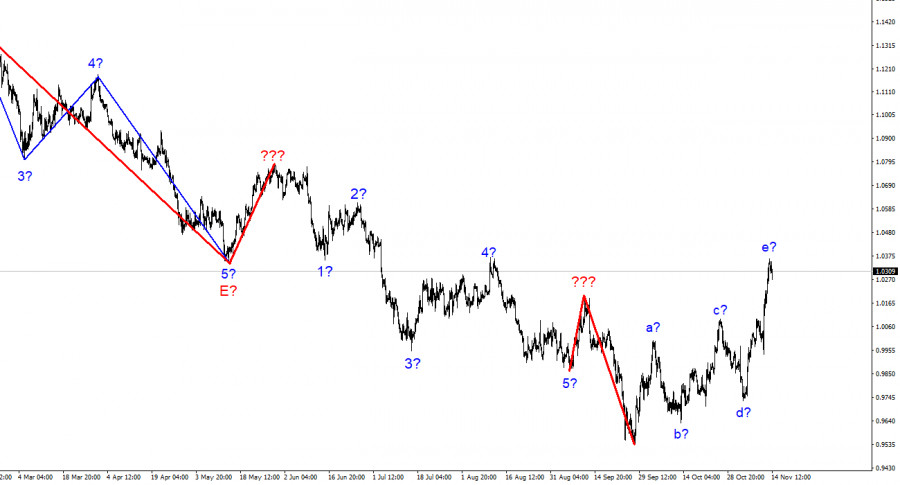
At the higher wave scale, the wave marking of the descending trend segment becomes noticeably more complicated and lengthens. We saw five upward waves, which are most likely the a-b-c-d-e structure. The construction of a downward trend section may resume after the completion of the construction of this section.

Chin Zhao,
Analytical expert of InstaForex
© 2007-2023
EURUSD
Euro vs US Dollar
Select timeframe
5
min
15
min
30
min
1
hour
4
hours
1
day
1
week
Start trade
Start trade
  • Grand Choice
    Contest by
    InstaForex
    InstaForex always strives to help you
    fulfill your biggest dreams.
    JOIN CONTEST
  • Chancy Deposit
    Deposit your account with $3,000 and get $8000 more!
    In March we raffle $8000 within the Chancy Deposit campaign!
    Get a chance to win by depositing $3,000 to a trading account. Having fulfilled this condition, you become a campaign participant.
    JOIN CONTEST
  • Trade Wise, Win Device
    Top up your account with at least $500, sign up for the contest, and get a chance to win mobile devices.
    JOIN CONTEST
  • 100% Bonus
    Your unique opportunity to get a 100% bonus on your deposit
    GET BONUS
  • 55% Bonus
    Apply for a 55% bonus on your every deposit
    GET BONUS
  • 30% Bonus
    Receive a 30% bonus every time you top up your account
    GET BONUS

Recommended Stories

GBP/USD. Analysis for March 21, 2023

The wave analysis for the pound/dollar pair now appears to be challenging but does not call for any clarifications. The wave patterns for the euro and the pound differ somewhat

Chin Zhao 18:23 2023-03-21 UTC+2

EUR/USD. Analysis for March 21. The euro continues to rise before the FOMC meeting.

The recent increase in the euro's value has caused some confusion in the wave analysis on the 4-hour chart for the euro/dollar pair. Last week, we saw a sharp drop

Chin Zhao 18:03 2023-03-21 UTC+2

Elliott wave analysis of First Republic Bank for March 21, 2023

No doubt that First Republic Bank (FRB) is in great trouble. We thought that it would be an excellent candidate to show the Elliott Wave Principle in practical

Torben Melsted 07:20 2023-03-21 UTC+2

Elliott wave analysis of UNG for March 21, 2023

Natural gas has failed to rally above resistance at 8.97 and remains caught in the possible corrective decline in wave ii. We have revised our outlook as the failure

Torben Melsted 06:57 2023-03-21 UTC+2

GBP/USD. Analysis for March 20, 2023

The wave analysis for the pound/dollar pair now appears to be challenging but does not call for any clarifications. The wave patterns for the euro and the pound differ somewhat

Chin Zhao 18:00 2023-03-20 UTC+2

EUR/USD. Analysis for March 20, 2023

The wave analysis on the 4-hour chart for the euro/dollar pair becomes confused as the euro rises. We saw a sharp decrease in quotes last week, which may be seen

Chin Zhao 17:43 2023-03-20 UTC+2

Elliott wave analysis of EUR/JPY for March 20, 2023

EUR/JPY finally broke below the flag support line and should continue lower towards our long-term target near 133.55, with the first hurdle seen near the former low at 137.47. Short-term

Torben Melsted 06:09 2023-03-20 UTC+2

Elliott wave analysis of EUR/USD for March 20, 2023

EUR/USD is in a position where we have two possible scenarios. We could have seen the low of wave 4 with the failure spike down to 1.0542, our preferred count

Torben Melsted 06:02 2023-03-20 UTC+2

GBP/USD. Analysis for March 16, 2023

The wave analysis for the pound/dollar pair now appears to be challenging, but it does not call for any clarifications. The wave patterns for the euro and the pound differ

Chin Zhao 18:40 2023-03-16 UTC+2

EUR/USD. Analysis for March 16, 2023

The 4-hour chart for the euro/dollar pair still shows the same wave pattern, which is excellent because it allows us to predict how the situation will develop. It's also encouraging

Chin Zhao 18:19 2023-03-16 UTC+2
现在无法通话?
提出您的问题,用 在线帮助.