empty
 
 
28.11.2022 10:24 AM
Technical analysis of EUR/USD for November 28 to December 3

trend analysis

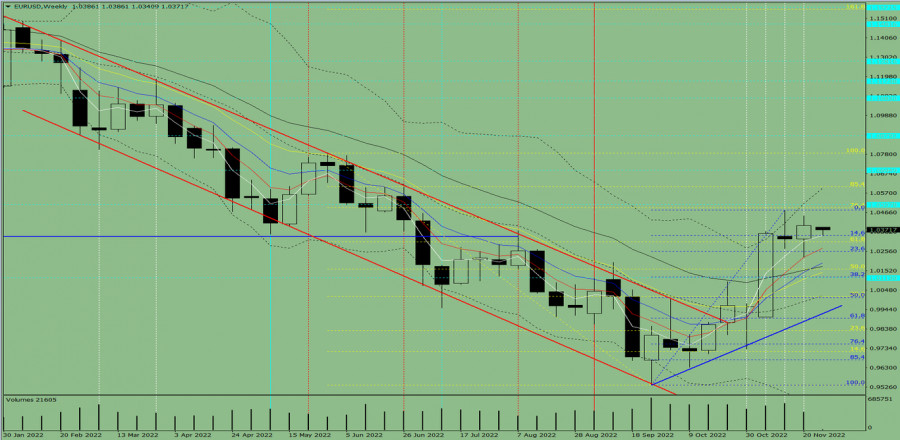
EUR/USD may start moving downward this week, from the level of 1.0395 (closing of the last weekly candle) to 1.0256, which is the 23.6% retracement level (blue dotted line). Then, it will bounce up to the upper fractal at 1.2479 (blue dotted line).

This image is no longer relevant

Fig. 1 (weekly chart)

Comprehensive analysis:

Indicator analysis - downtrend

Fibonacci levels - downtrend

Volumes - downtrend

Candlestick analysis - downtrend

Trend analysis - uptrend

Bollinger bands - downtrend

Monthly chart - uptrend

All this points to a downward movement in EUR/USD.

Conclusion: The pair will have a bearish trend, with no first upper shadow on the weekly black candle (Monday - down) and a second lower shadow (Friday - up).

So during the week, euro will fall from 1.0395 (closing of the last weekly candle) to the 23.6% retracement level at 1.0256 (blue dotted line), then bounce up to higher price levels.

Alternatively, quotes could dip from 1.0395 (closing of the last weekly candle) to the 14.6% retracement level at 1.0341 (blue dotted line), then go up to the upper fractal at 1.2479 (blue dotted line).

Stefan Doll,
Analytical expert of InstaForex
© 2007-2023
EURUSD
Euro vs US Dollar
Select timeframe
5
min
15
min
30
min
1
hour
4
hours
1
day
1
week
Start trade
Start trade
  • Grand Choice
    Contest by
    InstaForex
    InstaForex always strives to help you
    fulfill your biggest dreams.
    JOIN CONTEST
  • Chancy Deposit
    Deposit your account with $3,000 and get $8000 more!
    In March we raffle $8000 within the Chancy Deposit campaign!
    Get a chance to win by depositing $3,000 to a trading account. Having fulfilled this condition, you become a campaign participant.
    JOIN CONTEST
  • Trade Wise, Win Device
    Top up your account with at least $500, sign up for the contest, and get a chance to win mobile devices.
    JOIN CONTEST
  • 100% Bonus
    Your unique opportunity to get a 100% bonus on your deposit
    GET BONUS
  • 55% Bonus
    Apply for a 55% bonus on your every deposit
    GET BONUS
  • 30% Bonus
    Receive a 30% bonus every time you top up your account
    GET BONUS

Recommended Stories

Technical Analysis of Daily Price Movement of United States Dollar Currency index, Monday March 27 2023.

If we look on the daily chart of USD index, then there will be a few interesting things: 1. There is a deviation between price movement with Awesome Oscillator indicator

Arief Makmur 06:23 2023-03-27 UTC+2

Technical Analysis of Daily Price Movement Gold Commodity Asset, Monday March 27 2023.

On the daily chart, Gold commodity asset seems appear after broken below the level of 1959,23. Gold will return corrected below where this things confirmed by: 1. The Appearance

Arief Makmur 06:23 2023-03-27 UTC+2

Forecast for EUR/USD on March 27, 2023

The euro closed Friday with a 71-point drop. The price tried to get out of the target range of 1.0758/87, but it still ended the day within that range

Laurie Bailey 04:45 2023-03-27 UTC+2

Forecast for GBP/USD on March 27, 2023

The British pound fell by 55 points on Friday, breaking the support of the MACD indicator line. The price showed that the last two breakthroughs above this line on Wednesday

Laurie Bailey 04:45 2023-03-27 UTC+2

Forecast for AUD/USD on March 27, 2023

After the Australian dollar failed to break through the resistance at 0.6730 on March 22 and 23, it attacked the support at 0.6640 on Friday, March 24 . The Marlin

Laurie Bailey 04:45 2023-03-27 UTC+2

Technical analysis of GBP/USD for March 26, 2023

The GBP/USD pair broke resistance at 1.2135 which turned into strong support yesterday. This level coincides with 38.2% of Fibonacci retracement which is expected to act as major support today

Mourad El Keddani 22:42 2023-03-26 UTC+2

Technical analysis of EUR/USD for March 26, 2023

The EUR/USD pair rallied upwards strongly yesterday to breach the bearish channel's resistance and settles above it, opening the way to turn to the upside on the intraday and short-term

Mourad El Keddani 22:36 2023-03-26 UTC+2

Technical analysis on NZDUSD for week ending March 24th, 2023.

NZDUSD made another attempt this past week to break above the neckline resistance of 0.6265-0.6275. This was the second attempt and traders witnessed another failure and rejection. Price

Alexandros Yfantis 13:01 2023-03-26 UTC+2

Technical analysis on EURUSD for week ending March 24th, 2023.

EURUSD made new higher highs last week above 1.09 but bulls failed to hold their gains as price turned lower towards 1.0760. As we mentioned in previous posts

Alexandros Yfantis 12:45 2023-03-26 UTC+2

March 24, 2023 : EUR/USD daily technical review and trading opportunities.

The price level of 1.0800 remained a significant resistance level to offer SELL opportunities until the current upside movement was expressed. The next target is located around 1.1000 where

Mohamed Samy 16:55 2023-03-24 UTC+2
现在无法通话?
提出您的问题,用 在线帮助.