empty
 
 
28.11.2022 10:17 AM
EUR/USD and GBP/USD: trading plan for beginners on November 28

Specifics of economic calendar on November 25

The last trading week ended with an empty economic calendar and low trading volumes. The reason is the public holiday in the US, Thanksgiving Day. Thus, Thursday was a day-off and Friday was a shorter trading day.

Overview of technical charts on November 25

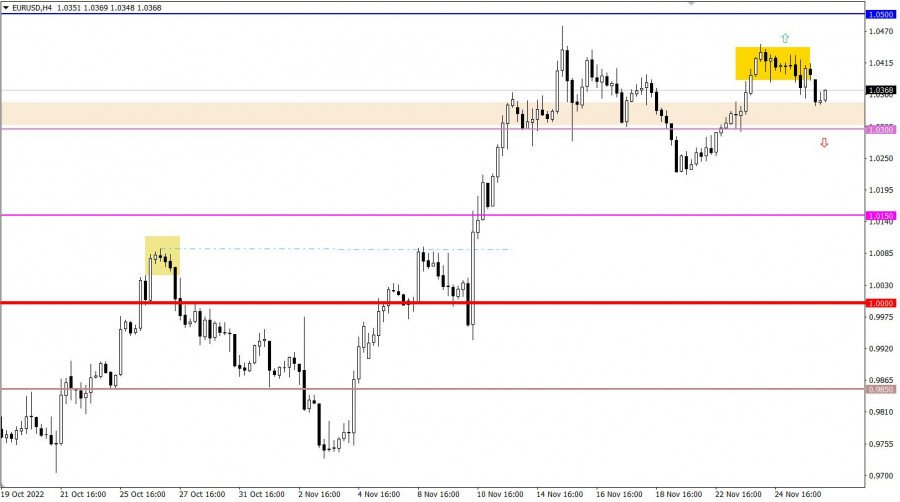
Having reached the peak of the upward cycle, EUR/USD entered the range-bound market. The price escaped the trading range, pushed downwards by speculative activity. As a result, the currency pair went below 1.0350.

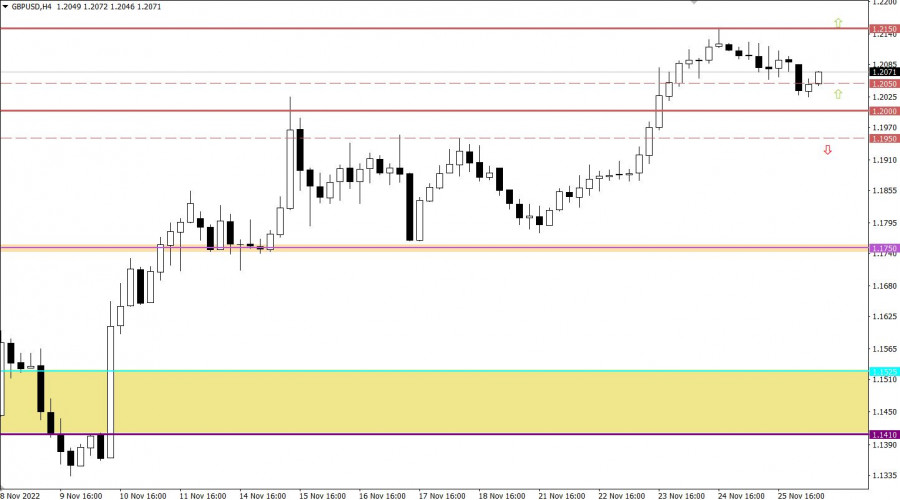
GBP/USD climbed to the interim resistance at 1.2150. Then, traders decided to accumulate short positions bit by bit. Eventually, the instrument began a retracement stage and the price rebounded to the upper border and psychological level of 1.2000 (1.2000/1.2050).

This image is no longer relevant

Economic calendar on November 28

All market players are resuming trading on Monday. Nevertheless, the week is opening with an empty economic calendar. Therefore, all investors and speculators can do is monitor the information environment and grasp breaking news from mass media.

Trading plan for EUR/USD on November 28

In this situation, if the price settles firmly below 1.0350, this may assure traders to increase short positions towards 1.03000, the level passed earlier. Further sellers' activity will depend on how the price will behave at around 1.0300.

This image is no longer relevant

Trading plan for GBP/USD on November 28

Under such market conditions, the psychological level of 1.2000 could serve as a pivot point for the sellers which in turn, will assure traders to cut short positions. If the actual price move meets expectations, the instrument might get stuck with the following price bounce which will update the local high of the upward cycle.

As for the downward scenario, the price should settle below 1.1950 to make this forecast come true. In this case, traders could revise sentiment on GBP towards bearish.

This image is no longer relevant

What's on the charts

The candlestick chart type is white and black graphic rectangles with lines above and below. With a detailed analysis of each individual candle, you can see its characteristics relative to a particular time frame: opening price, closing price, intraday high and low.

Horizontal levels are price coordinates, relative to which a price may stop or reverse its trajectory. In the market, these levels are called support and resistance.

Circles and rectangles are highlighted examples where the price reversed on history. This color highlighting indicates horizontal lines that may put pressure on the asset's price in the future.

The up/down arrows are landmarks of the possible price direction in the future.

Gven Podolsky,
Analytical expert of InstaForex
© 2007-2023
EURUSD
Euro vs US Dollar
Select timeframe
5
min
15
min
30
min
1
hour
4
hours
1
day
1
week
Start trade
Start trade
  • Grand Choice
    Contest by
    InstaForex
    InstaForex always strives to help you
    fulfill your biggest dreams.
    JOIN CONTEST
  • Chancy Deposit
    Deposit your account with $3,000 and get $8000 more!
    In March we raffle $8000 within the Chancy Deposit campaign!
    Get a chance to win by depositing $3,000 to a trading account. Having fulfilled this condition, you become a campaign participant.
    JOIN CONTEST
  • Trade Wise, Win Device
    Top up your account with at least $500, sign up for the contest, and get a chance to win mobile devices.
    JOIN CONTEST
  • 100% Bonus
    Your unique opportunity to get a 100% bonus on your deposit
    GET BONUS
  • 55% Bonus
    Apply for a 55% bonus on your every deposit
    GET BONUS
  • 30% Bonus
    Receive a 30% bonus every time you top up your account
    GET BONUS

Recommended Stories

CAD/JPY: further growth still possible

The CAD/JPY pair dropped a little in the short term but this could be only temporary. The price could resume its growth as long as it stays above the uptrend

Ralph Shedler 19:00 2023-03-31 UTC+2

GBP/USD: trading plan for the American session on March 31 (analysis of morning deals)

In my morning forecast, I focused on the level of 1.2365 and suggested deciding to enter the market based on it. Let's take a look at the 5-minute chart

Miroslaw Bawulski 18:20 2023-03-31 UTC+2

EUR/USD outlook for March 31, 2023

Today is the last day of the week, month, and quarter, and EUR/USD ends it on a positive wave. Despite a noticeable decline in February, the pair managed to fully

Jurij Tolin 15:12 2023-03-31 UTC+2

EUR/USD: trading plan for American session on March 31. Overview of morning trades. EUR declines following eurozone inflation data

In my morning article, I turned your attention to 1.0872 and recommended making decisions with this level in focus. Now, let's look at the 5-minute chart and figure out what

Miroslaw Bawulski 13:17 2023-03-31 UTC+2

Trading tips for EUR/USD

EUR/USD halted rally around the weekly highs, forming a distribution zone. But since an accumulation zone is yet to be reached, traders can still buy to raise the price further

Andrey Shevchenko 10:41 2023-03-31 UTC+2

EUR/USD and GBP/USD: trading plan for beginners on March 31, 2023

US GDP expanded less than expected in the 4 quarter. The American economy rose by 2.6%, slightly less than 3.2% in the 3 quarter. According to the US Bureau

Gven Podolsky 10:19 2023-03-31 UTC+2

GBP/USD: trading plan for European session on March 31, 2023. Commitments of Traders report. GBP/USD to hit fresh monthly highs

A few nice entry signals were generated yesterday. Let's look at the M5 chart to get a picture of what happened. In my previous review, I considered entering the market

Miroslaw Bawulski 08:30 2023-03-31 UTC+2

EUR/USD: trading plan for European session on March 31. COT report. EUR returns to monthly high

Yesterday, traders received several signals to enter the market. Let us take a look at the 5-minute chart to figure out what happened. Earlier, I asked you to pay attention

Miroslaw Bawulski 08:28 2023-03-31 UTC+2

GBP/USD: Forecast and trading signals on March 31. COT report. Detailed analysis of price movement and trades. The moment of truth for the pound

On Thursday, GBP/USD also stretched its upward movement. Volatility was not as strong as the euro, and the pound did not have any reasons to rise

Paolo Greco 08:05 2023-03-31 UTC+2

EUR/USD: Forecast and trading signals on March 31. COT report. Detailed analysis of price movement and trades. The euro found a new reason to rise

On Thursday, EUR/USD stretched its upward movement. While the last three days passed without any fundamental and macroeconomic background (and the euro still rose), on Thursday, some reports were published

Paolo Greco 08:03 2023-03-31 UTC+2
现在无法通话?
提出您的问题,用 在线帮助.