empty
 
 
08.12.2022 11:54 AM
EUR/USD, GBP/USD: trading plan for beginners on December 8, 2022

Macroeconomic calendar on December 7

The third estimate of GDP for the third quarter released by the European statistics agency Eurostat yesterday showed that the European economy expanded by 2.3% year-on-year and 0.3% on a quarterly basis. Notably, the preliminary quarterly GDP estimate assumed an increase of 2.1% and 0.2% in annual and quarterly terms respectively.

In the second quarter of 2022, GDP rose at an annual rate of 4.2% and by 0.8% quarter-on-quarter.

An upward revision of GDP data supported the euro.

Overview of trading charts for December 7

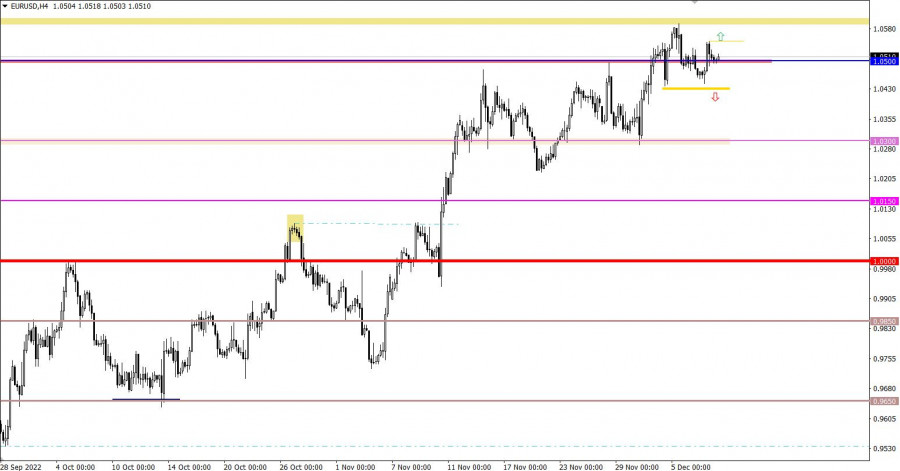
The euro/dollar pair fell below the level of 1.0500 but then turned up again. As a result, the volume of long positions surged, which allowed the price to rise above the level of 1.0500.

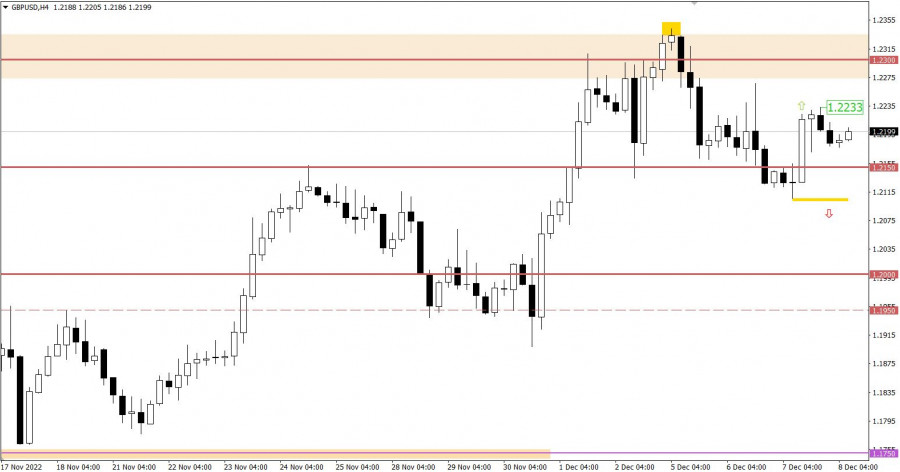
The pound/dollar pair got out the sideways range by gaining upside momentum. The price bounced off the level of 1.2150 and settled above 1.2200, which suggested an increase in the volume of long pound positions.

This image is no longer relevant

Macroeconomic calendar on December 8

Today's macroeconomic calendar includes data on weekly jobless claims in the United States. Economists predict a decline in their total volume. This is a positive factor for the US labor market provided that the indicator meets analysts' forecasts.

Statistics details:

US continuing jobless claims are expected to decline to 1.575 million from 1.608 million.

US initial jobless claims are forecast to increase to 230,000 from 225,000.

Time targeting

US Jobless Claims - 4:30 PM (GMT+3)

EUR/USD trading plan for December 8

In this situation, it is worth focusing on the following levels: 1.0550 (yesterday's high) and 1.1430 (variable support). If the price consolidates above 1.0550 or fixes below 1.1430 on the four-hour chart, it will be possible to determine a further price direction. Until then, the pair is likely to drift sideways near the indicated levels.

This image is no longer relevant

GBP/USD trading plan for December 8

If the price stays firm above 1.2200, it may gain strong upside momentum. In this case, the quote is expected to head for the high of the ascending cycle, that is, the level of 1.2343. Otherwise, it may start moving sideways along the level of 1.2150, which will indicate investor uncertainty.

This image is no longer relevant

What's on trading charts?

The candlestick chart shows graphical white and black rectangles with lines from above and below. While conducting a detailed analysis of each individual candlestick, one can notice its features intrinsic to a particular time frame: the opening price, the closing price, as well as the highest and lowest prices;

Horizontal levels are price levels, at which the price may stop or reverse. They are called support and resistance levels;

Circles and rectangles are highlighted examples where the price reversed in the course of its history. This color highlighting indicates horizontal lines, which can exert pressure on the quote in the future;

Up/down arrows signal a possible future price direction.

Gven Podolsky,
Analytical expert of InstaForex
© 2007-2023
EURUSD
Euro vs US Dollar
Select timeframe
5
min
15
min
30
min
1
hour
4
hours
1
day
1
week
Start trade
Start trade
  • Grand Choice
    Contest by
    InstaForex
    InstaForex always strives to help you
    fulfill your biggest dreams.
    JOIN CONTEST
  • Chancy Deposit
    Deposit your account with $3,000 and get $8000 more!
    In March we raffle $8000 within the Chancy Deposit campaign!
    Get a chance to win by depositing $3,000 to a trading account. Having fulfilled this condition, you become a campaign participant.
    JOIN CONTEST
  • Trade Wise, Win Device
    Top up your account with at least $500, sign up for the contest, and get a chance to win mobile devices.
    JOIN CONTEST
  • 100% Bonus
    Your unique opportunity to get a 100% bonus on your deposit
    GET BONUS
  • 55% Bonus
    Apply for a 55% bonus on your every deposit
    GET BONUS
  • 30% Bonus
    Receive a 30% bonus every time you top up your account
    GET BONUS

Recommended Stories

USD/CAD: uptrend seems over

The USD/CAD pair is trading at 1.3707 and it moves somehow sideways. The price action signaled that the upside movement (uptrend) ended. As you can see on the H1 chart

Ralph Shedler 14:01 2023-03-22 UTC+2

XAU/USD outlook for March 22, 2023

In a situation of remaining high inflation, political and economic uncertainties, and amid expectations of soft decisions from the Fed, purchases of defensive assets—yen, government bonds, and gold—are again very

Jurij Tolin 13:48 2023-03-22 UTC+2

GBP/USD: trading plan for Nort American session on March 22, 2023. Overview of morning trading. GBP/USD goes up amid higher inflation

In the morning, I considered entering the market at 1.2232. Let's see what has happened in the M5 chart. The price broke through the level but no retest followed, meaning

Miroslaw Bawulski 12:46 2023-03-22 UTC+2

EUR/USD: trading plan for American session on March 22. Overview of morning trades. EUR reaches new high

In my morning article, I turned your attention to 1.0758 and recommended making decisions with this level in focus. Now, let's look at the 5-minute chart and figure out what

Miroslaw Bawulski 12:44 2023-03-22 UTC+2

EUR/USD and GBP/USD trading plan for beginners on March 22, 2023

A report from the National Association of Realtors says existing home sales in the United States increased 14.5% in February from the previous month to 4.58 million homes year-on-year. This

Gven Podolsky 10:05 2023-03-22 UTC+2

GBP/USD: trading plan for European session on March 22. Commitment of Traders. GBP settles at monthly highs

Yesterday, there were several excellent entry points. Now, let's look at the 5-minute chart and figure out what actually happened. In my morning article, I turned your attention to 1.2227

Miroslaw Bawulski 07:50 2023-03-22 UTC+2

EUR/USD: Trading plan for European session on March 22. COT report. EUR continues climbing amid high inflation

Yesterday, traders received several signals to enter the market. Let us take a look at the 5-minute chart to clear up the market situation. Earlier, I asked

Miroslaw Bawulski 07:48 2023-03-22 UTC+2

Trading plan for USD index on March 22, 2023

The US dollar index dropped through the 102.60 mark intraday on Tuesday before finding mild bids again. Potential still remains for a dip through the 102.50 mark before resuming

Oscar Ton 07:22 2023-03-22 UTC+2

Trading plan for EURUSD on March 22, 2023

EURUSD rallied through 1.0780 intraday on Tuesday before finding mild resistance. The single currency pair is seen to be trading close to 1.0775 at this point in writing

Oscar Ton 07:08 2023-03-22 UTC+2

GBP/USD: Forecast and trading signals on March 22. COT report. Detailed analysis of price movement and trades. The pound plummeted before the central bank meetings.

On Tuesday, GBP/USD surprisingly showed a completely different direction of movement than the EUR/USD pair. And as usual there were no reasons for that, because there were no important fundamental

Paolo Greco 03:41 2023-03-22 UTC+2
现在无法通话?
提出您的问题,用 在线帮助.