EUR/USD keeps moving sideways, but its bull run in recent months is hard to explain. The pair may rise due to the fact that the ECB's interest rate may be raised higher than that of the US Federal Reserve in the first six months of 2023. Last week, Philadelphia FRB President Patrick Harker said that rates should be increased to 5% or slightly above and then tightening should pause. Before the publication of US inflation data, experts saw interest rates between 5.25% and 6%. As a result, the dovish scenario is weighing on the greenback.
Still, there are many technical and fundamental factors in favor of the greenback. The thing is that there have not always been reasons for a steep rise in the euro, which usually marks the beginning of a new trend. When it comes to macro statistics, traders ignored the latest negative reports coming from the eurozone and upbeat data from the US. We can hardly explain the market's reaction to the NFP report. Nevertheless, such market behavior has become a habit. Since there are no sell signals now, a bearish correction may occur. Still, it is too early to sell the pair at the moment.
Inflation in many countries has been slowing down lately. Some traders may have thought that the actions of world central banks started bearing fruit. However, we should look at the price charts of oil and natural gas. World central banks used to blame higher energy prices for driving inflation further up. However, we may notice a tendency that prices have been moving south in the past 4-5 months. Thus, oil dropped to $80 from $122 per barrel, and natural gas fell in price at least 2.5 times. In other words, inflation was no longer affected by the energy factor. So, it began to slow down. In addition, a continuation of the tightening cycle was also putting pressure on prices.
Nevertheless, some analysts note that oil and gas may rise again as China may fully reopen after the Lunar New Year at the end of January. Goldman Sachs commodities expert Geoffrey Curry believes that oil could rise to $110 per barrel in the third quarter of 2023. If restrictions are lifted, demand for gasoline and fuel will creep up. The European Union, which mostly imports energy products, may again face a rise in prices for almost all goods since their price includes transportation costs, which are directly correlated with the cost of gasoline. In addition, many industries use natural gas. Thus, if someone was content about the fall in inflation in the EU, their joy may be premature and short-lived. If inflation goes down too slowly or stops falling at all, the ECB will have to raise rates more aggressively. It remains to be seen whether it is able to raise rates to 5-6%, given their current level of 2.5%. If rates are raised too high, the EU will enter a recession, although many experts now say that it can be avoided if the energy crisis is over. Therefore, the fact that inflation in the eurozone decreased once or twice does not necessarily mean that this tendency will continue until consumer prices reach the 2% target.
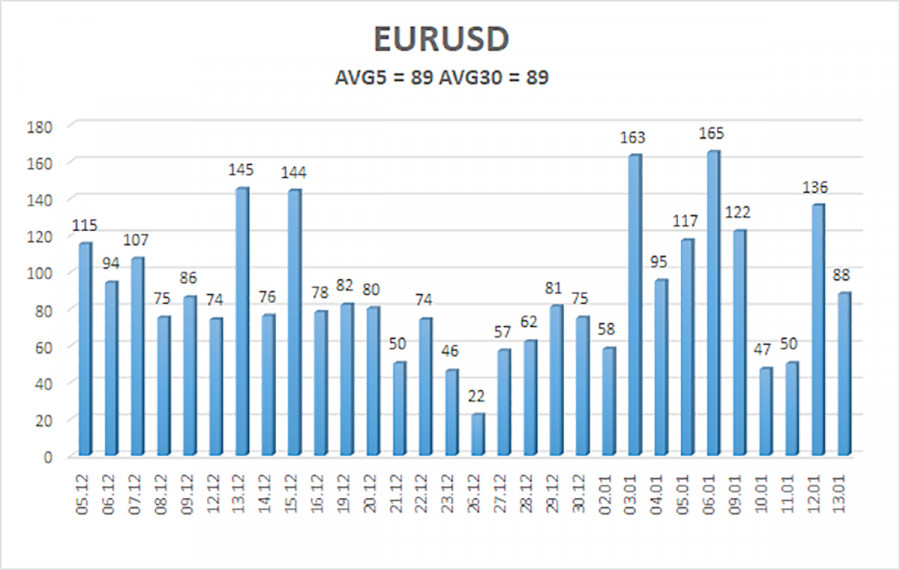
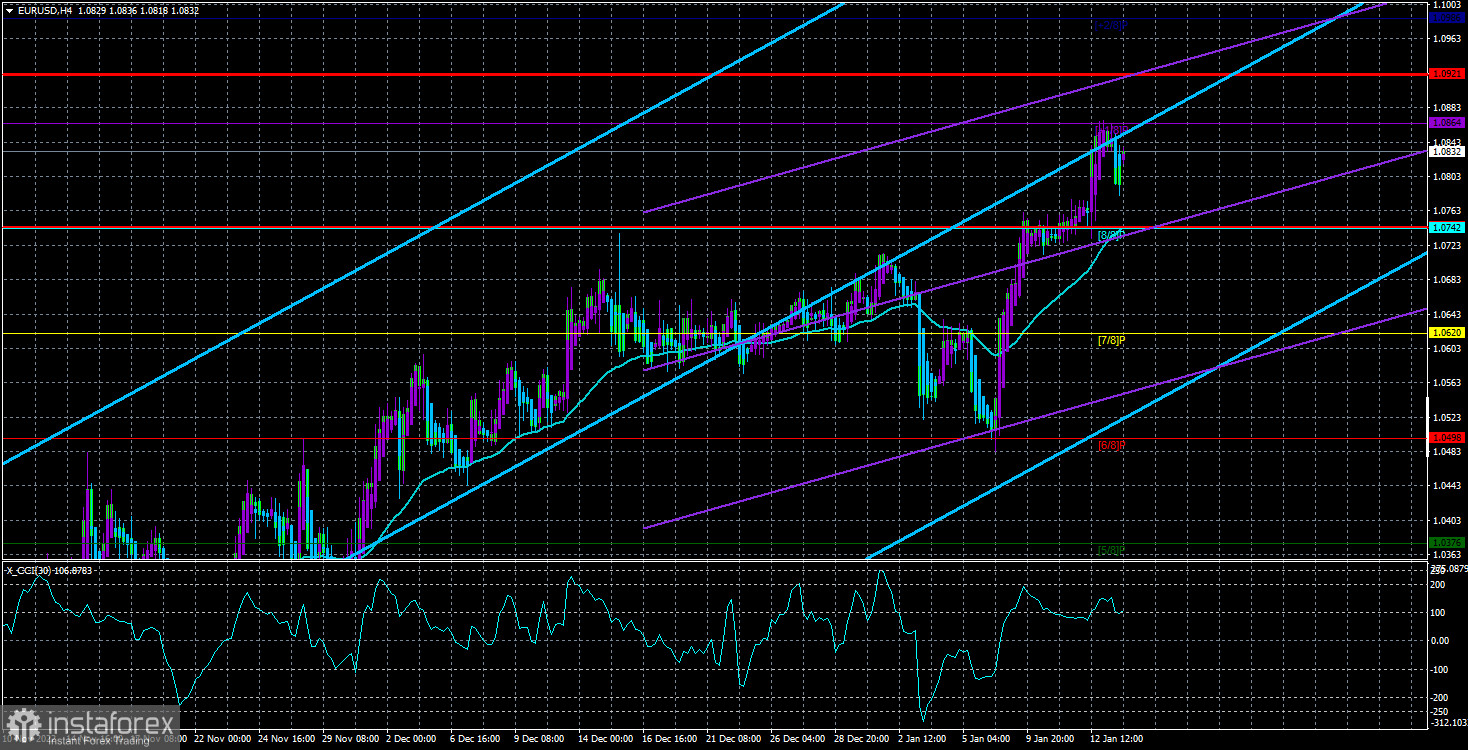
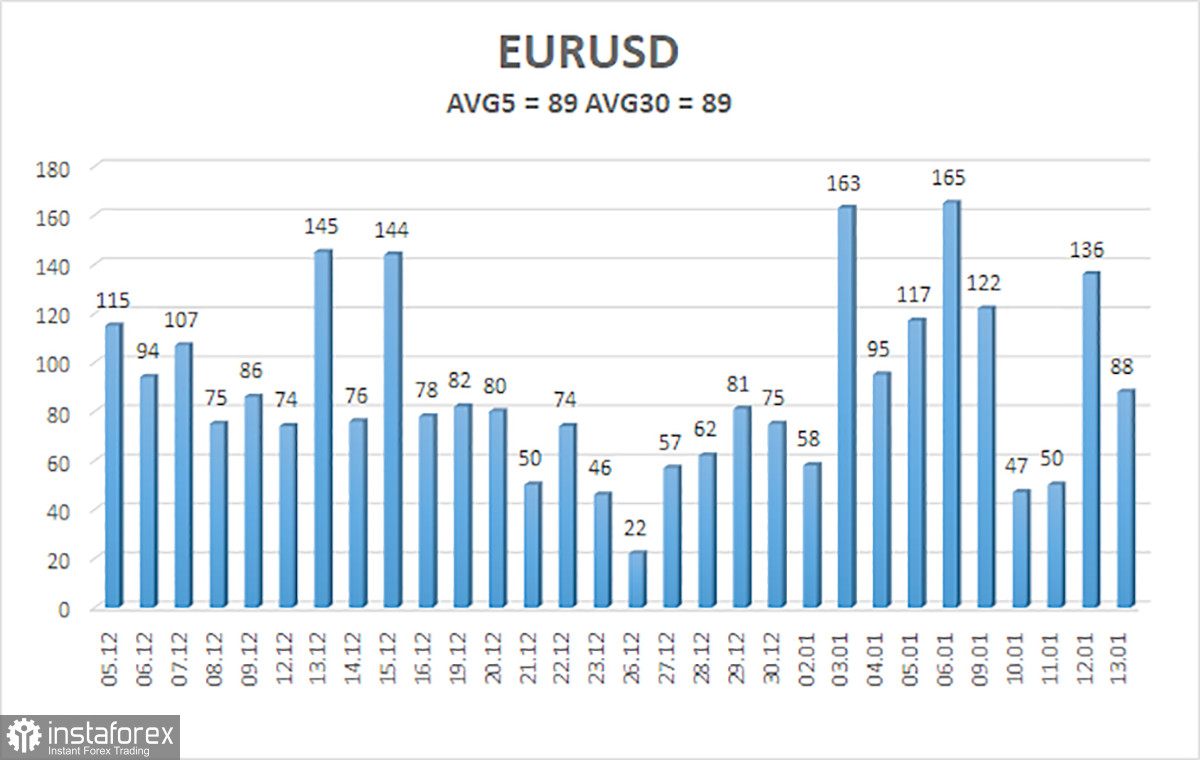
The 5-day average volatility of EUR/USD totaled 89 pips on January 15 and was evaluated as average. On Monday, the pair is expected to move in a range between 1.0743 and 1.0921. Heiken Ashi's upward reversal will signal the beginning of an uptrend.
Support:
S1 – 1.0742
S2 – 1.0620
S3 – 1.0498
Resistance:
R1 – 1.0864
R2 – 1.0986
Outlook:
EUR/USD is retracing up. So, long positions could be opened with targets at 1.0864 and 1.0921 if Heiken Ashi reverses to the upside. Short positions could be considered after consolidation below the moving average with the target at 1.0620.
Indicators on charts:
Linear Regression Channels help identify the current trend. If both channels move in the same direction, a trend is strong.
Moving Average (20-day, smoothed) defines the short-term and current trends.
Murray levels are target levels for trends and corrections.
Volatility levels (red lines) reflect a possible price channel the pair is likely to trade in within the day based on the current volatility indicators.
CCI indicator. When the indicator is in the oversold zone (below 250) or in the overbought area (above 250), it means that a trend reversal is likely to occur soon.