M5 chart of EUR/USD
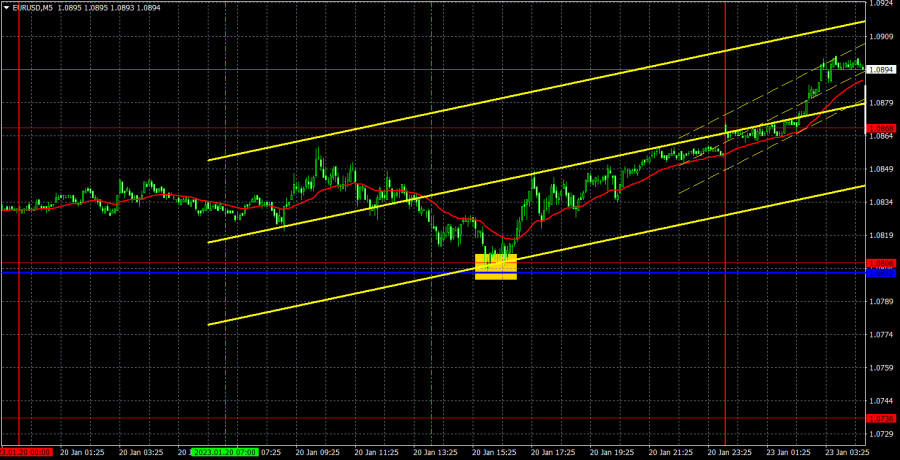
Last Friday, EUR/USD was trading flat again. The end of last week was quite dull since the market decided to take a break. Macroeconomic and fundamental backgrounds were almost absent, but at the same time traders did not use this time for a correction. Thus, the euro once again failed to move down at least a little bit. The pair spent several days near the local highs, and on Monday it easily updated them, and this week we will see growth. Surely, there were no important events during the weekend or on Monday night, that's why the euro was aiming for growth again without any reasons. Reminder: the meetings of the Federal Reserve and the European Central Bank will be held in a week and the central banks' rates are one of the key factors, which explains why the euro grows. The Fed is almost guaranteed to lower the tightening rate to 0.25% and the ECB will continue to raise the rate at 0.5%. Based on the fact that the rate gap is starting to narrow, traders are still buying the euro.
There was only one trading signal on Friday. The price rebounded from the 1.0802-1.0806 area at the beginning of the US trading session, and then went up about 30 points. That is how much profit could be made on Friday.
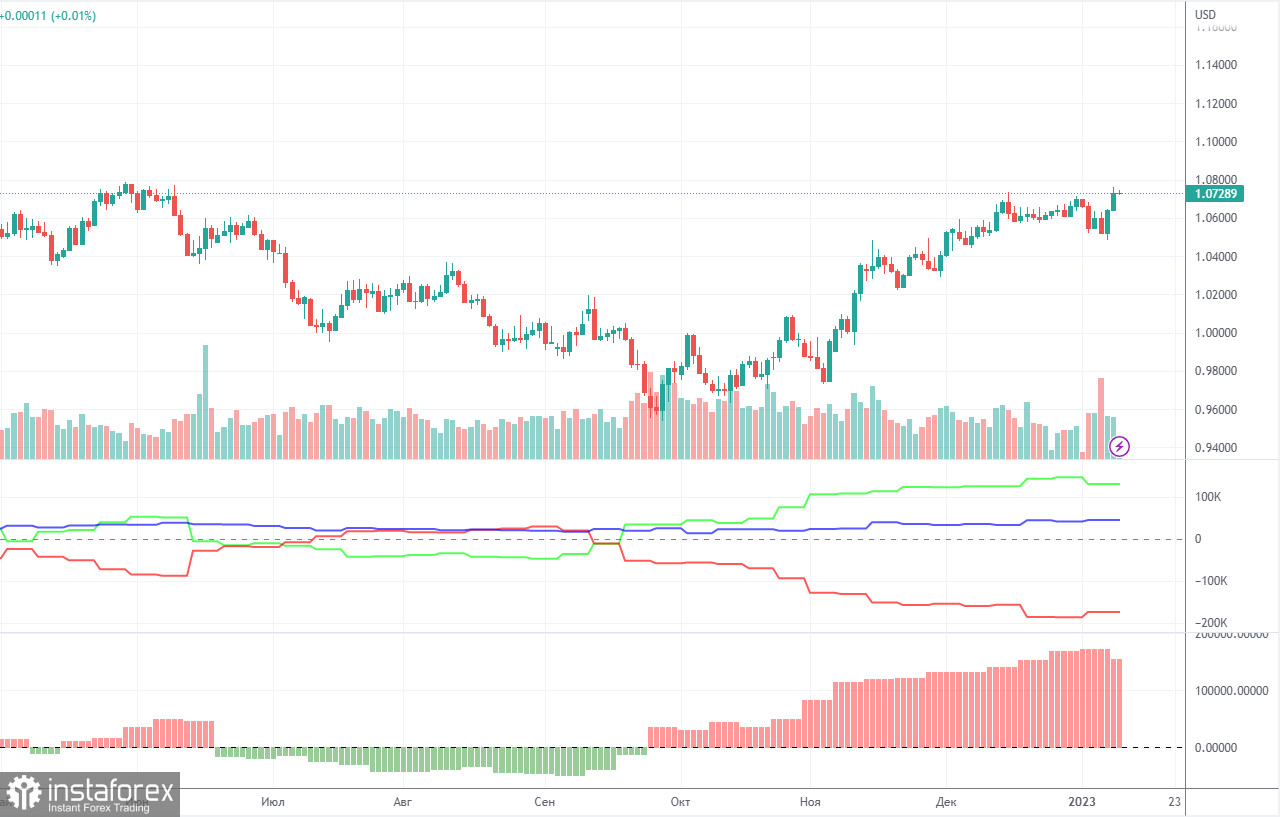
COT report
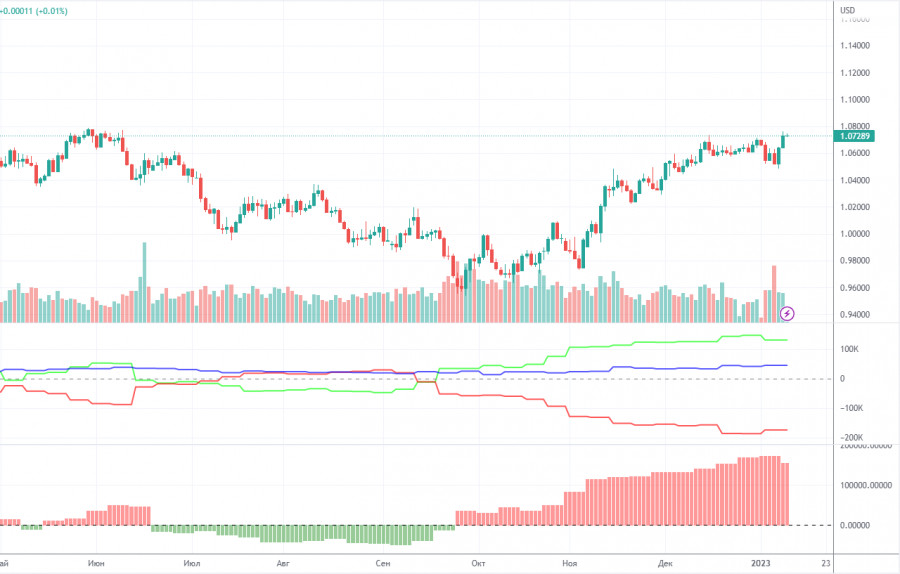
The COT reports for the euro in the last few months have been fully consistent with what is happening in the market. You can clearly see on the chart that the net position of big players (the second indicator) has been growing since early September. Around the same time, the euro started to grow. At this time, the net position of the non-commercial traders has been bullish and strengthens almost every week, but it is a rather high value that allows us to assume that the uptrend will end soon. Notably, the green and red lines of the first indicator have moved far apart from each other, which often precedes the end of the trend. During the given period, the number of long positions held by non-commercial traders increased by 16,000, whereas the number of short positions rose by 11,000. Thus, the net positions increased by 5,000. The number of long positions is 135,000 higher than the number of short positions opened by non-commercial traders. So the question now is how long will the big players increase their longs? Moreover, from a technical perspective, a bearish correction should have started a long time ago. In my opinion, this process can not continue for another 2 or 3 months. Even the net position indicator shows that we need to "unload" a bit, that is, to correct. The overall number of short orders exceeds the number of long orders by 48,000 (702,000 vs. 655,000).
H1 chart of EUR/USD
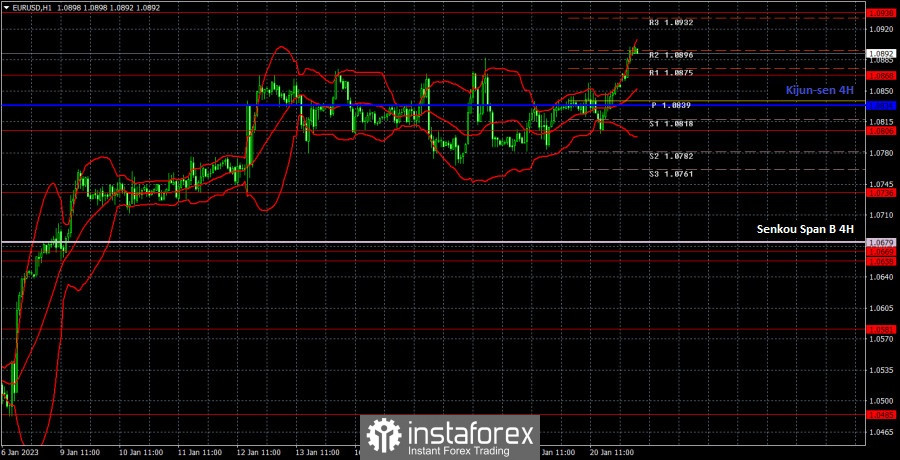
You can see on the one-hour chart that EUR/USD has spent about a week in the 1.0806-1.0868 horizontal channel, but today it could come out of it through the upper limit. Therefore, the ascending movement may continue this week, but there are still no sell signals. On Monday, the pair may trade at the following levels: 1.0658-1.0669, 1.0736, 1.0806, 1.0868, 1.0938, 1.1036, 1.1137 and also Senkou Span B (1.0679) and Kijun Sen (1.0834). Lines of the Ichimoku indicator may move during the day, which should be taken into account when determining trading signals. There are also support and resistance levels, but signals are not formed near these levels. Bounces and breakouts of the extreme levels and lines could act as signals. Don't forget about stop-loss orders, if the price covers 15 pips in the right direction. This will prevent you from losses in case of a false signal. On January 23, ECB President Christine Lagarde will give another speech in the EU, but it will be late in the evening. In the US, there are no major events scheduled for tonight. We do not expect a strong market reaction to Lagarde's speech but at the same time the euro might continue to rise even without a clear reason.
What we see on the trading charts:
Price levels of support and resistance are thick red lines, near which the movement may end. They do not provide trading signals.
The Kijun-sen and Senkou Span B lines are the lines of the Ichimoku indicator, moved to the one-hour chart from the 4-hour one. They are strong lines.
Extreme levels are thin red lines from which the price bounced earlier. They provide trading signals.
Yellow lines are trend lines, trend channels, and any other technical patterns.
Indicator 1 on the COT charts reflects the net position size of each category of traders.
Indicator 2 on the COT charts reflects the net position size for the non-commercial group.