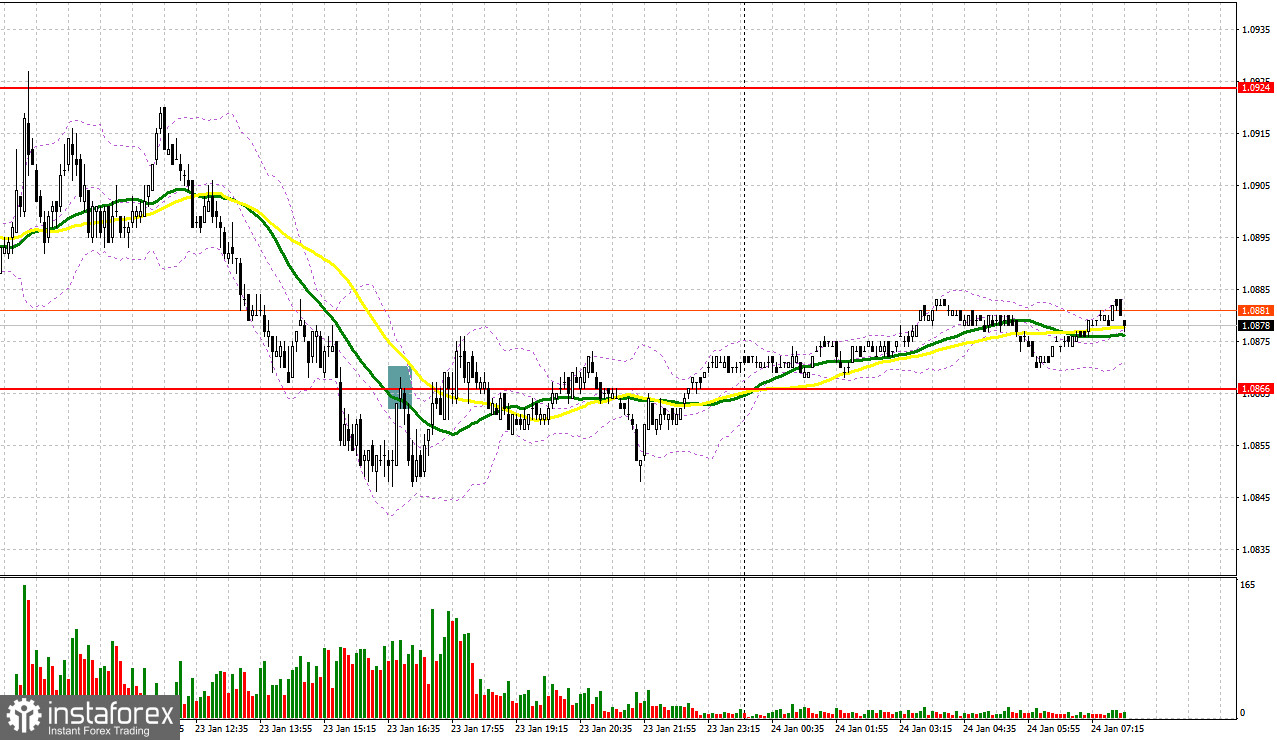
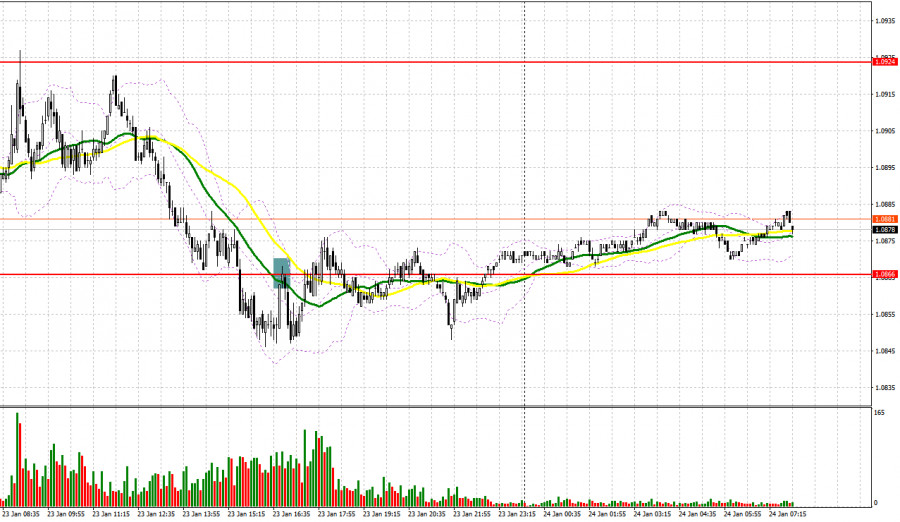
Yesterday, traders received just one signal to enter the market. Let us take a look at the 5-minute chart to figure out what happened. Earlier, I asked you to pay attention to the level of 1.0931 to decide when to enter the market. Since the market volatility was low, the pair failed to show a false breakout of this level. Bulls tried to hit 1.0931 but failed. In the second part of the day, a breakout and a reverse test of 1.0866 led to a sell signal. However, the pair did not show a considerable decline. After a 15-pip drop, demand for the euro resumed mounting.
Conditions for opening long positions on EUR/USD:
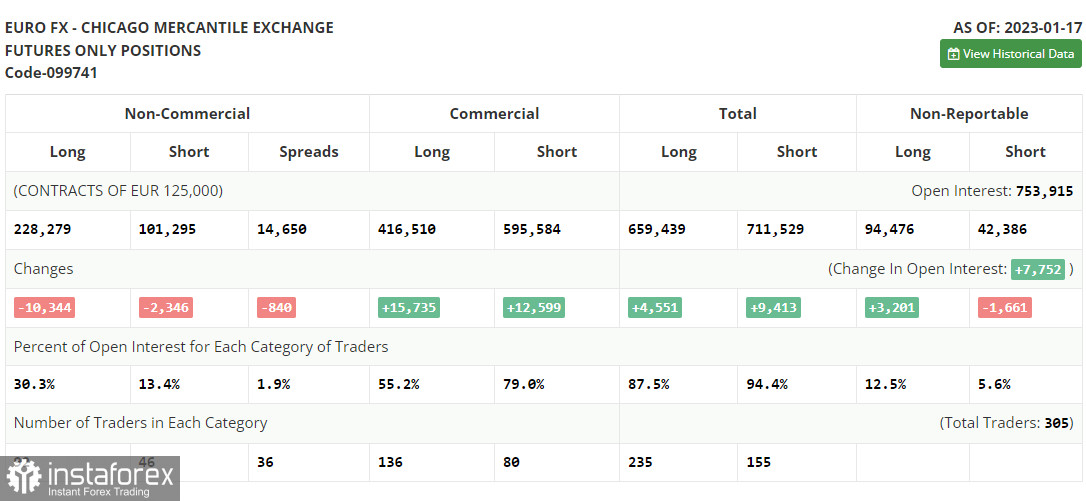
First of all, let us focus on the futures market and changes in the COT report. According to the COT report from January 17, the number of both long and short positions dropped. Traders took the wait-and-see approach after a rapid rise in the euro ahead of the Fed meeting that is scheduled for the next week. Quite weak fundamental data on the US economy, especially a decline in retail sales in December, pointed to the worsening of the overall situation in the country. It means that further monetary policy tightening may lead to even more negative results. On the other hand, inflation continues to slacken, thus allowing the Fed officials to revise the key interest rate hike. Meanwhile, the euro is supported by the ECB's officials who insist on a further key rate hike to combat inflation. Against the backdrop, the euro/dollar pair is reaching new local highs. The COT report unveiled that the number of long non-commercial positions declined by 10,344 to 228,279, while the number of short non-commercial positions slid by 2,346 to 101,295. At the end of the week, the total non-commercial net position decreased to 126,984 from 134,982. All this suggests that investors believe in further growth in the euro but they are still waiting for a clearer picture from central banks on future interest rates. The weekly closing price rose to 1.0833 against 1.0787.
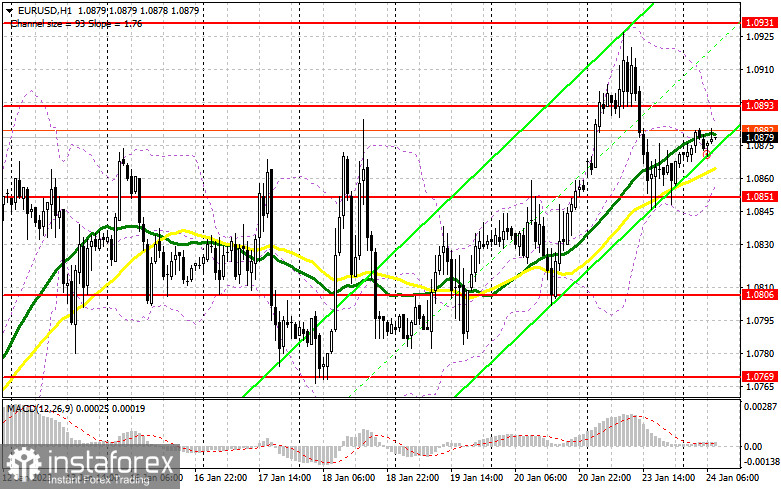
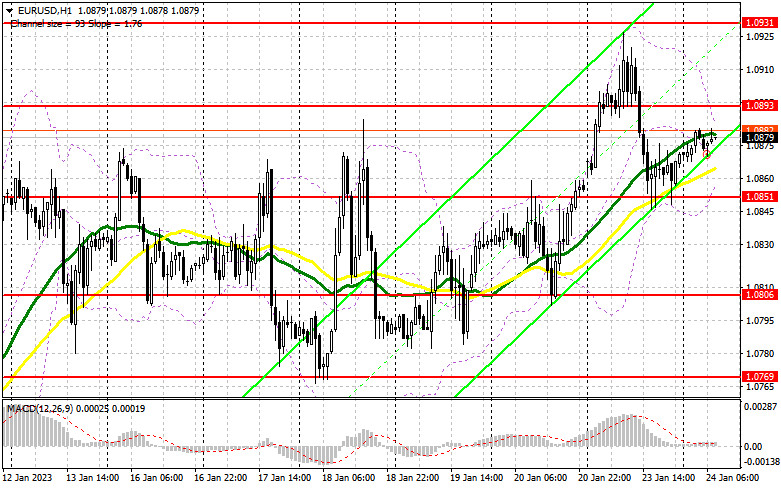
Today, Germany and the eurozone will disclose a lot of information, which may support the bullish momentum seen last week. This will become possible if Germany's GfK consumer climate indicator, manufacturing PMI, as well as Germany's and the eurozone's services PMIs are above the forecast. It will be better if indicators exceed the 50-point threshold. It will prove the fact that the eurozone economy managed to avoid a long recession. Such positive data will support the euro. In case of a negative reaction to the data, bulls should prevent the pair from falling below the support level of 1.0851 formed yesterday. Only a false breakout of this level will give a long signal with the target at the nearest resistance level of 1.0893. A breakout and a downward test of this level will allow the pair to jump to this year's high of 1.0931, giving hope for a higher rise to 1.0969. The farthest target is located at a new monthly high of 1.1006. If the pair touches this level, the bullish trend will continue. It will be wise to lock in profits at this level. If the euro/dollar pair decreases and buyers fail to protect 1.08512, pressure on the pair will climb. Only a false breakout of the next support level of 1.0806 will give a buy signal. It is also possible to go long just after a bounce off the high of 1.0769 or even lower – from 1.0728, expecting a rise of 30-35 pips.
Conditions for opening short positions on EUR/USD:
Yesterday, bulls fail to hit 1.0893, which may seriously affect the upward movement. Today, the pair should reach a new high, but it may face considerable resistance. Until the pair hovers below 1.0893, bears will have a chance for a further decline. That is why bulls should protect this area. The price may test this level amid strong fundamental data from the eurozone. It will be better to sell after a false breakout of 1.0893, which will lead to a decline to the support level of 1.0581. A breakout and settlement below this area as well as an upward test will give an additional sell signal. In this case, the pair may slide to 1.0806. This will be the first correctional downward movement that may affect the bullish trend. The pair may decrease even deeper amid positive data from the US. If the euro/dollar pair increases during the European session and bears fail to protect 1.0893, bulls will keep control over the market. In the event of this, traders should avoid selling the asset until the price touches 1.0931. A false breakout of this level will give a sell signal. Traders may also go short after a rebound from the high of 1.0969 or even higher – from 1.1006, expecting a decline of 30-35 pips.
Signals of indicators:
Moving Averages
Trading is performed near 30- and 50-day moving averages, which points to market uncertainty.
Note: The author considers the period and prices of moving averages on the one-hour chart which differs from the general definition of the classic daily moving averages on the daily chart.
Bollinger Bands
In case of a decline, the lower limit of the indicator located at 1.0851 will act as support. If the pair increase, the resistance level will be formed by the upper limit of the range of 1.0893.
Description of indicators
- Moving average (a moving average determines the current trend by smoothing volatility and noise). The period is 50. It is marked in yellow on the chart.
- Moving average (a moving average determines the current trend by smoothing volatility and noise). The period is 30. It is marked in green on the graph.
- MACD indicator (Moving Average Convergence/Divergence - convergence/divergence of moving averages). A fast EMA period is 12. A slow EMA period is 26. The SMA period is 9.
- Bollinger Bands. The period is 20.
- Non-profit speculative traders are individual traders, hedge funds, and large institutions that use the futures market for speculative purposes and meet certain requirements.
- Long non-commercial positions are the total number of long positions opened by non-commercial traders.
- Short non-commercial positions are the total number of short positions opened by non-commercial traders.
- The total non-commercial net position is a difference in the number of short and long positions opened by non-commercial traders.