Analyzing Wednesday's trades
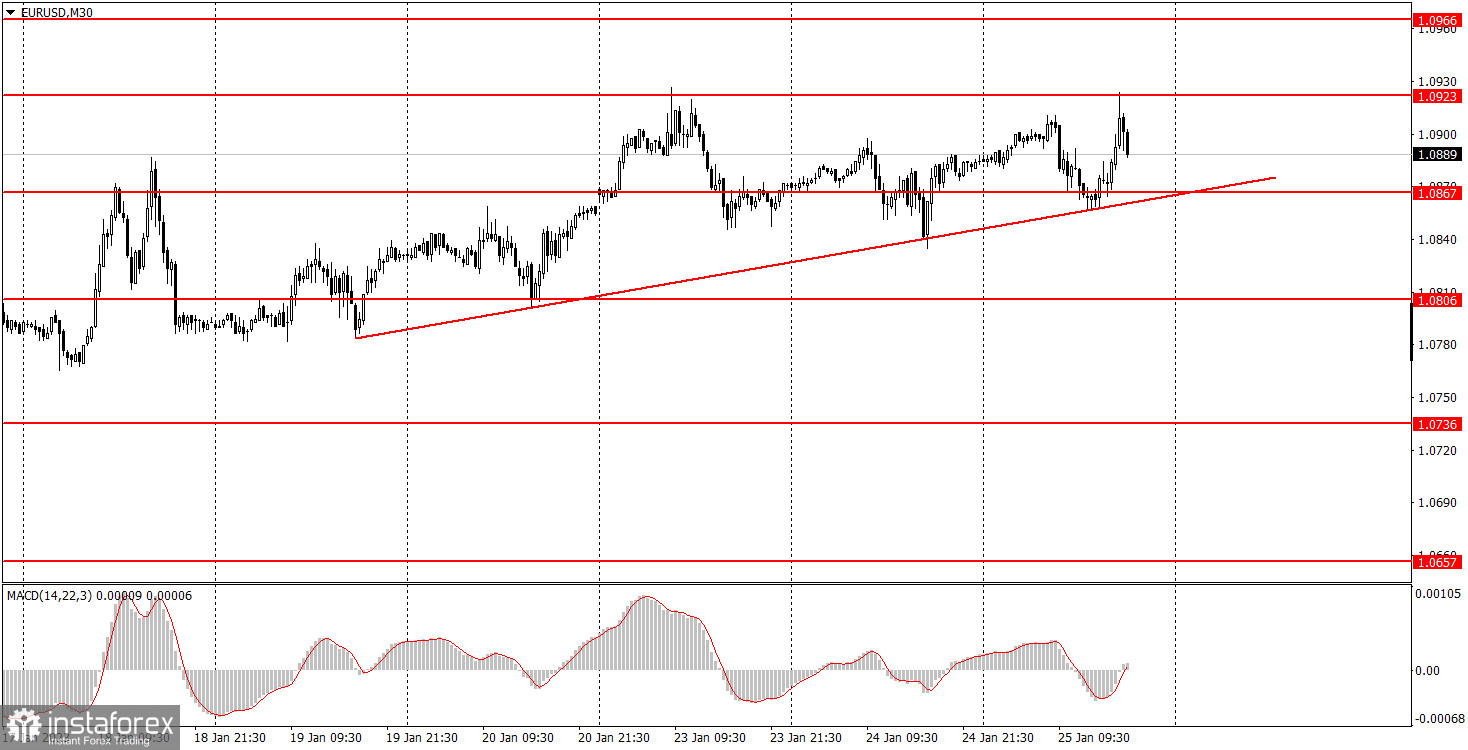
EUR/USD on 30M chart
EUR/USD found the strength to rise on Wednesday. An ascending trend line was formed, which has as many as four points of support, and the pair managed to rise to the 1.0923 mark for the second time. Technically, we cannot say "managed to grow", because this growth was not preceded by a decline. The price did not even settle below the nearest level of 1.0867. Therefore, this just means that the uptrend persists. On Wednesday, there were no important reports or events in the US or EU. Therefore, all of the movements within the day are purely technical. The pair keeps edging up, because there is simply no reason for it to rise sharply. At the same time, the market refuses to let go of its long positions, so the pair is rising instead of falling. The new trend line gives us a reference point if the price goes below it. We have seen the price cross the ascending trend line many times in the past weeks, after which the growth was restored almost immediately.
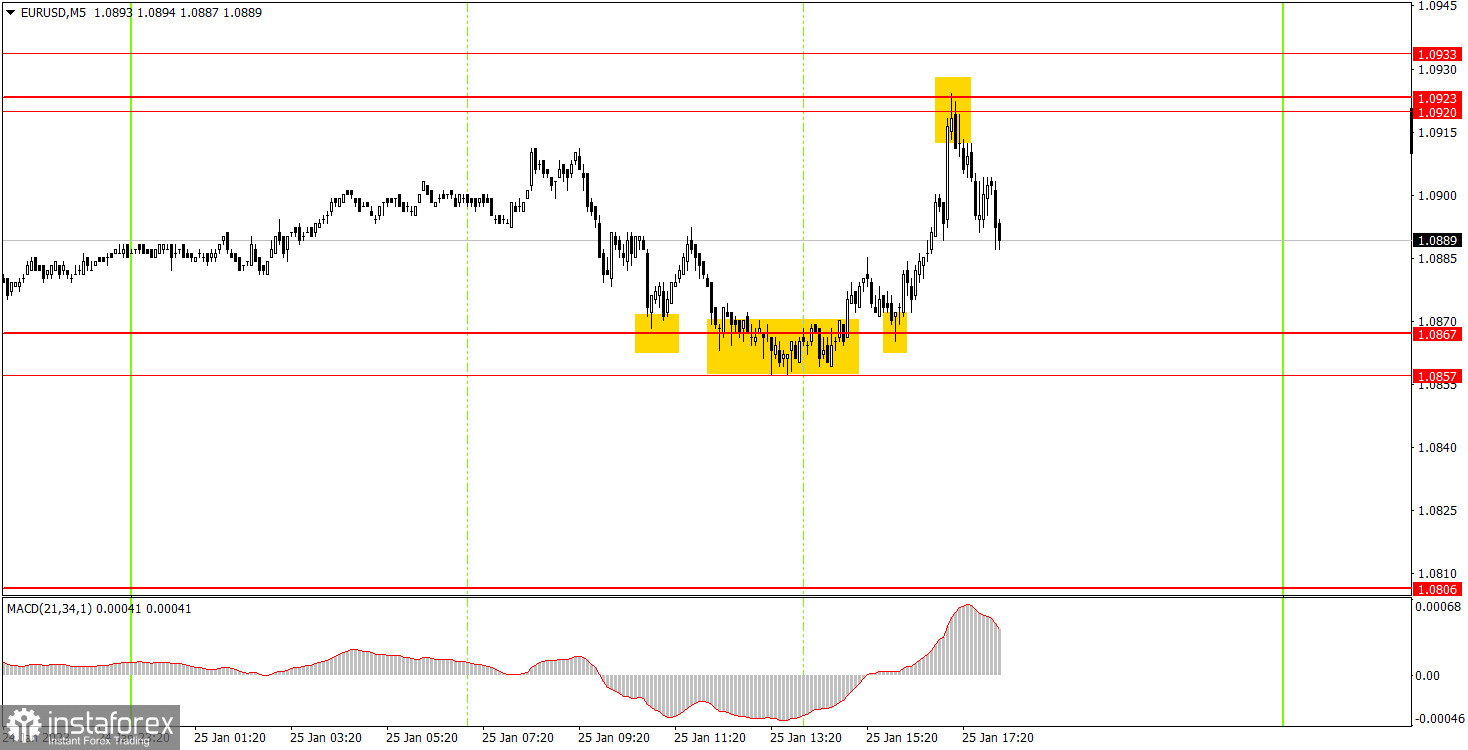
EUR/USD on M5 chart
The trading signals on the 5-minute chart were almost perfect. In fact, the current movement has signs of a flat as well, because the price is moving sideways much more briskly than up or down. We added another level to the chart - 1.0857, which forms a support area with 1.0867. And the price bounced from 1.0867 three times. Once in a not so accurate manner. The upward movement only started after the third bounce and the price was able to move up by more than 15 pips. Therefore, you should have opened a position only once. Later, the quotes reached the area of 1.0920-1.0923, from which they bounced and formed a sell signal. The longs gained about 30 pips, and the shorts could gain about 20 pips by the evening. Therefore, novice traders managed to earn 50 pips according to our recommendations.
Trading tips on Thursday:
The pair maintains the uptrend on the 30-minute chart and a new ascending trend line has been formed. Nevertheless, if we evaluate the pair's movements during the last 2 weeks, the movement is more like a flat. Therefore, we should be ready for the corresponding movements every day. There are very few important events this week, which is an excellent environment for a flat movement to persist. On the 5-minute chart, it is recommended to trade at the levels 1.0657-1.0668, 1.0697, 1.0736, 1.0768, 1.0806, 1.0857-1.0867, 1.0920-1.0923-1.0933, 1.0966, 1.0989. As soon as the price passes 15 pips in the right direction, you should set a Stop Loss to breakeven. On Thursday, reports on the fourth quarter GDP and durable goods will be released in the US. I believe that the reaction to these reports will be soft and may not even break the flat.
Basic rules of the trading system:
1) The strength of the signal is determined by the time it took the signal to form (a rebound or a breakout of the level). The quicker it is formed, the stronger the signal is.
2) If two or more positions were opened near a certain level based on a false signal (which did not trigger a Take Profit or test the nearest target level), then all subsequent signals at this level should be ignored.
3) When trading flat, a pair can form multiple false signals or not form them at all. In any case, it is better to stop trading at the first sign of a flat movement.
4) Trades should be opened in the period between the start of the European session and the middle of the US trading hours when all positions must be closed manually.
5) You can trade using signals from the MACD indicator on the 30-minute time frame only amid strong volatility and a clear trend that should be confirmed by a trendline or a trend channel.
6) If two levels are located too close to each other (from 5 to 15 pips), they should be considered support and resistance levels.
On the chart:
Support and Resistance levels are the levels that serve as targets when buying or selling the pair. You can place Take Profit near these levels.
Red lines are channels or trend lines that display the current trend and show in which direction it is better to trade now.
The MACD indicator (14, 22, and 3) consists of a histogram and a signal line. When they cross, this is a signal to enter the market. It is recommended to use this indicator in combination with trend patterns (channels and trendlines).
Important announcements and economic reports that can be found on the economic calendar can seriously influence the trajectory of a currency pair. Therefore, at the time of their release, we recommend trading as carefully as possible or exiting the market in order to avoid sharp price fluctuations.
Beginners on Forex should remember that not every single trade has to be profitable. The development of a clear strategy and money management is the key to success in trading over a long period of time.