Analyzing Thursday's trades:
EUR/USD on 30M chart
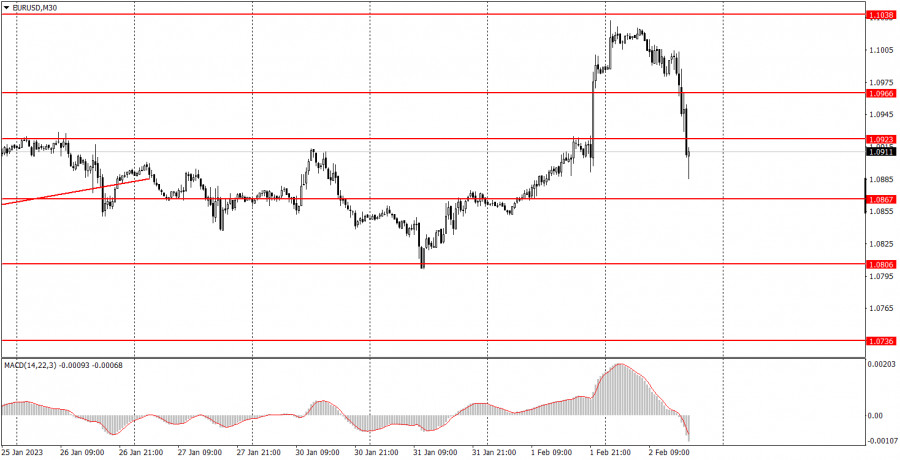
EUR/USD continued to show volatile movements. This is not surprising, because the results of the Federal Reserve meeting were announced on Wednesday night, and the results of the European Central Bank meeting on Thursday afternoon. The pair showed some movements that were not quite logical, but the reaction of traders to both meetings and speeches of the heads of central banks can be interpreted differently. On Wednesday, EUR grew undeservedly and now it has already fallen, though the results of the ECB meeting can also be considered hawkish. We always say that in the cases with such a strong fundamental background we can never be sure in which direction the price will go. And given the spike in volatility on such days, the situation becomes even more complicated. That's why it is best to take such movements philosophically, it is rarely possible to explain them anyway. After the sharp growth on Wednesday, we have seen the euro edge down, so it is impossible to make a conclusion about the trend at the moment. The market will need to wait for Friday's US data and then calm down, and after that it is possible to draw some conclusions.
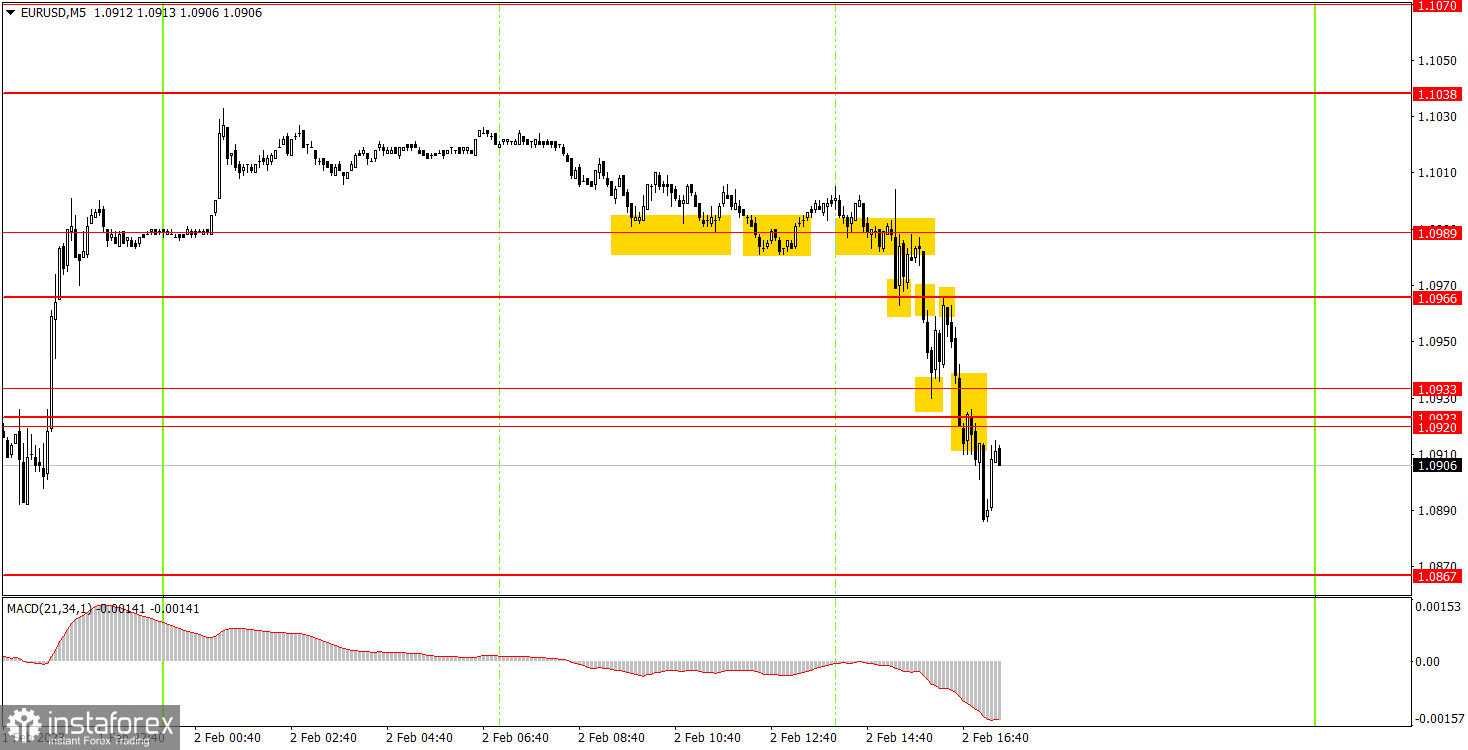
EUR/USD on M5 chart
A huge number of trading signals were formed because the volatility was off the scale. If the pair moved more or less calmly at the European trading session, then the "storm" started with the opening of the US session (when the ECB meeting results were announced). The pair had plenty of levels, and it was impossible to predict the pair's direction even after the central bank announced its decision. Therefore, I believe that you could work out the two signals from the European session (they duplicated each other), but it was necessary to leave the market at the beginning of the US session. The long position did not bring any profit, it was closed with a small loss. There was no need to work out the succeeding signals since the movements were very sharp, both buy and sell signals were formed.
Trading tips on Friday:
On the 30-minute chart, the pair showed ultra-volatile movement, now it is impossible to draw a conclusion about the trend. If you did not pay attention to Wednesday's growth, we can conclude that the flat is still present. But the pair might be quite far from the current price values on Friday. On the 5-minute chart, it is recommended to trade at the levels 1.0657-1.0668, 1.0697, 1.0736, 1.0768, 1.0806, 1.0857-1.0867, 1.0920-1.0923-1.0933, 1.0966, 1.0989, 1.1038. As soon as the price passes 15 pips in the right direction, you should set a Stop Loss to breakeven. On Friday, the European Union will release several PMIs and the US will release a whole bunch of data, among which I would highlight unemployment reports, NonFarm Payrolls and the ISM service sector index. These reports might have a big influence on market sentiment. We have another very volatile day ahead of us.
Basic rules of the trading system:
1) The strength of the signal is determined by the time it took the signal to form (a rebound or a breakout of the level). The quicker it is formed, the stronger the signal is.
2) If two or more positions were opened near a certain level based on a false signal (which did not trigger a Take Profit or test the nearest target level), then all subsequent signals at this level should be ignored.
3) When trading flat, a pair can form multiple false signals or not form them at all. In any case, it is better to stop trading at the first sign of a flat movement.
4) Trades should be opened in the period between the start of the European session and the middle of the US trading hours when all positions must be closed manually.
5) You can trade using signals from the MACD indicator on the 30-minute time frame only amid strong volatility and a clear trend that should be confirmed by a trendline or a trend channel.
6) If two levels are located too close to each other (from 5 to 15 pips), they should be considered support and resistance levels.
On the chart:
Support and Resistance levels are the levels that serve as targets when buying or selling the pair. You can place Take Profit near these levels.
Red lines are channels or trend lines that display the current trend and show in which direction it is better to trade now.
The MACD indicator (14, 22, and 3) consists of a histogram and a signal line. When they cross, this is a signal to enter the market. It is recommended to use this indicator in combination with trend patterns (channels and trendlines).
Important announcements and economic reports that can be found on the economic calendar can seriously influence the trajectory of a currency pair. Therefore, at the time of their release, we recommend trading as carefully as possible or exiting the market in order to avoid sharp price fluctuations.
Beginners on Forex should remember that not every single trade has to be profitable. The development of a clear strategy and money management is the key to success in trading over a long period of time.