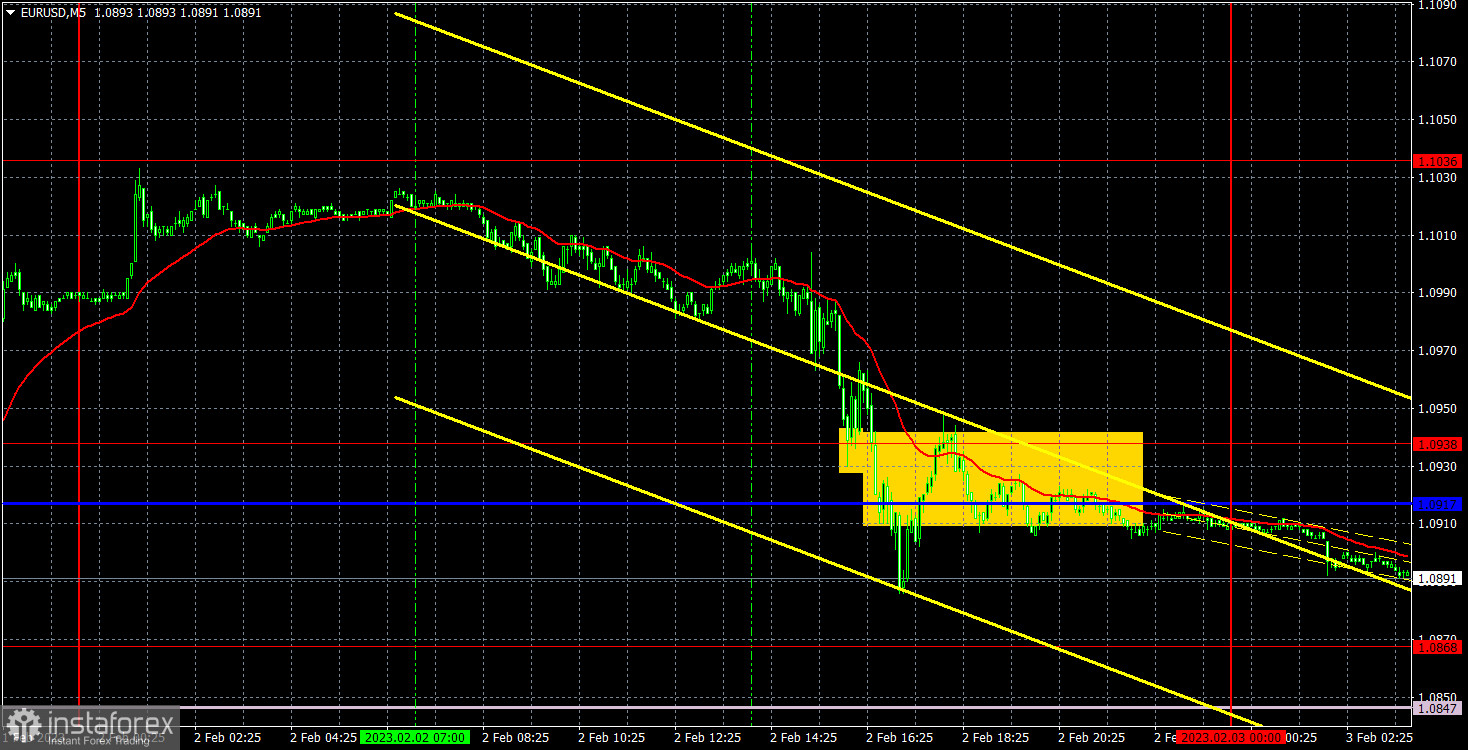
M5 chart of EUR/USD
EUR/USD did nothing but fall on Thursday. We have been waiting a long time for the euro to collapse and I said that the market had already worked out the rate hike in February and March. So, if the pair did not rise the day before, we would say that everything progressed logically. However, don't forget that the euro rose on Wednesday evening due to Federal Reserve Chairman Jerome Powell's hawkish speech. If you only look at the results of the meetings and the market's reaction, it is very difficult to understand traders. Essentially, traders were getting rid of the currency whose central bank signaled its willingness to keep raising rates. I believe that the euro can and should enter the long-awaited bearish correction. If it continues to rise after the events of the last two days, it makes no sense to speak about the logic of the market movements at all.
Yesterday's movement was very good, but too impulsive. The market ignored the technical benchmarks because it was too focused on the important fundamental background. Therefore, the pair failed to reach 1.1036, and there was no sell signal. Thus, we failed to catch the beginning of the fall yesterday, and the first signals were formed in the US trading session after the outcome of the European Central Bank meeting. I believe that traders should not have entered the market during this period of time since there was a high probability of sharp and frequent reversals and high volatility.
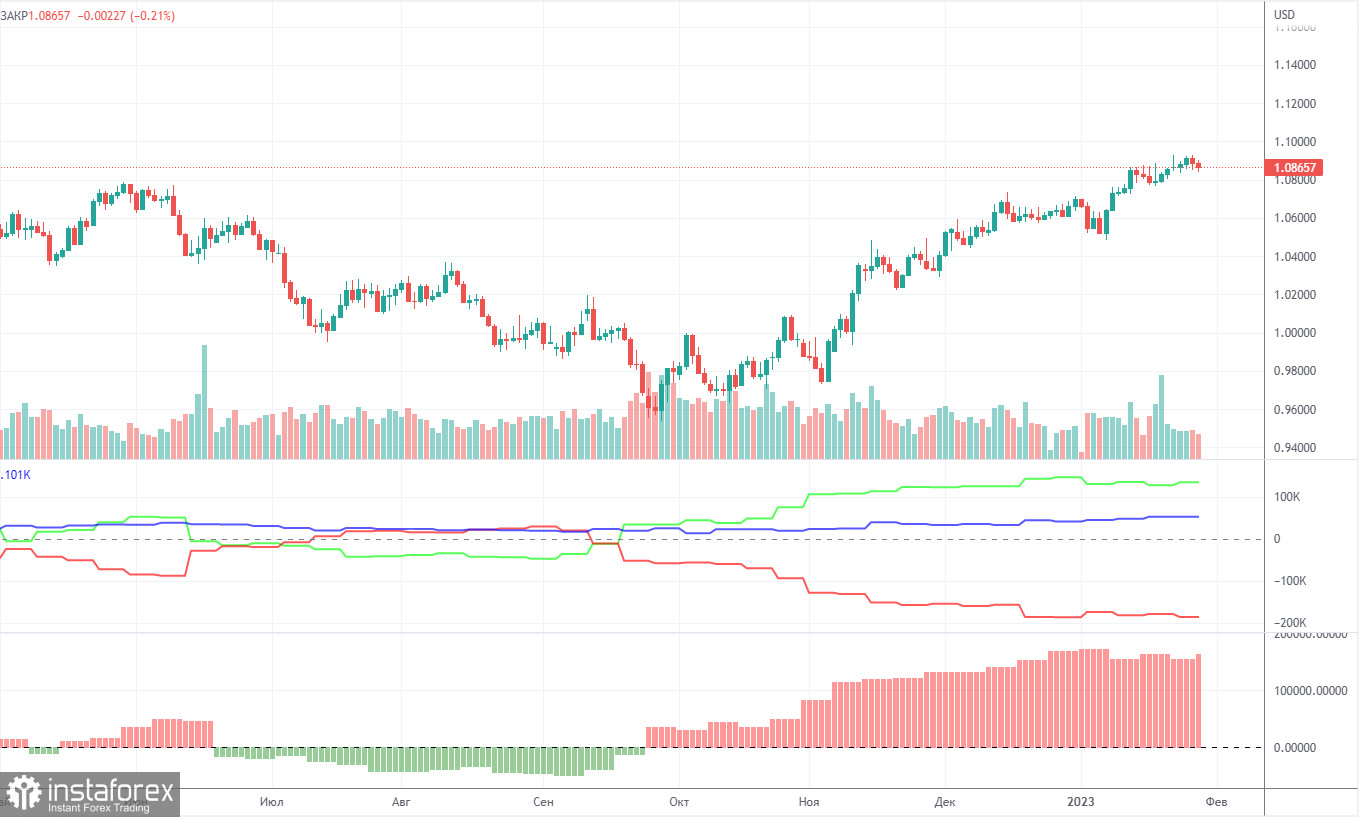
COT report
The COT reports for the euro in the last few months have been fully consistent with what is happening in the market. You can clearly see on the chart that the net position of big players (the second indicator) has been growing since early September. Around the same time, the euro started to grow. At this time, the net position of the non-commercial traders has been bullish and strengthens almost every week, but it is a rather high value that allows us to assume that the uptrend will end soon. Notably, the green and red lines of the first indicator have moved far apart from each other, which often precedes the end of the trend. During the given period, the number of long positions held by non-commercial traders decreased by 9,500, whereas the number of short positions fell by 2,000. Thus, the net positions decreased by 7,500. Now the number of long positions is higher than the number of short positions opened by non-commercial traders by 134,000. So now the question is: how long will the big players increase their longs? From a technical perspective, a bearish correction should have started a long time ago. In my opinion, this process can not continue for another 2 or 3 months. Even the net position indicator shows that we need to "unload" a bit, that is, to correct. The overall number of short orders exceeds the number of long orders by 52,000 (732,000 vs. 680,000).
H1 chart of EUR/USD
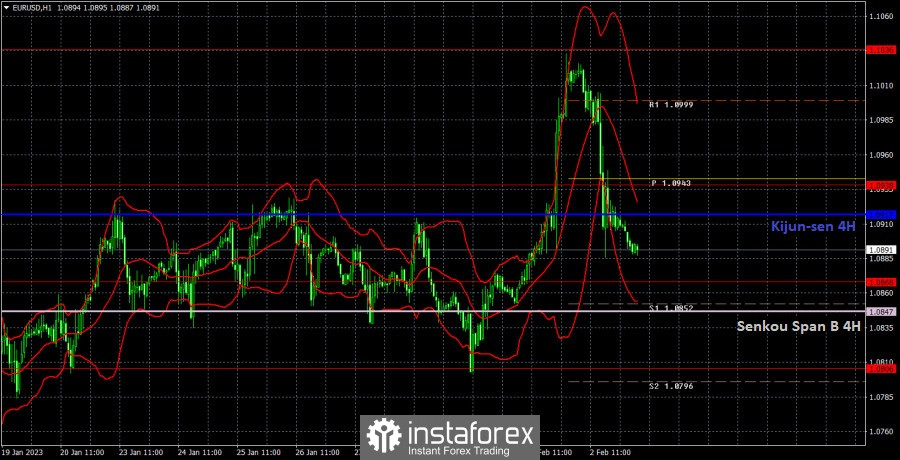
On the one-hour chart, EUR/USD left the sideways channel and managed to show two powerful turns of movement. First, it rose, then fell. As of Friday morning, the price is between the lines of the Ichimoku indicator, but today won't be a peaceful day. The US will release important macro data, which can trigger a new "storm" in the currency market. On Friday, the pair may trade at the following levels: 1.0736, 1.0806, 1.0868, 1.0938, 1.1036, 1.1137, 1.1185, 1.1234, as well as Senkou Span B (1.0847) and Kijun Sen (1.0917). Lines of the Ichimoku indicator may move during the day, which should be taken into account when determining trading signals. There are also support and resistance levels, but signals are not formed near these levels. Bounces and breakouts of the extreme levels and lines could act as signals. Don't forget about stop-loss orders, if the price covers 15 pips in the right direction. This will prevent you from losses in case of a false signal. On February 3, the EU will only release its services PMI. In the US, we can look forward to the NonFarm Payrolls, unemployment and the ISM non-manufacturing index. Volatility may remain high today.
What we see on the trading charts:
Price levels of support and resistance are thick red lines, near which the movement may end. They do not provide trading signals.
The Kijun-sen and Senkou Span B lines are the lines of the Ichimoku indicator, moved to the one-hour chart from the 4-hour one. They are strong lines.
Extreme levels are thin red lines from which the price bounced earlier. They provide trading signals.
Yellow lines are trend lines, trend channels, and any other technical patterns.
Indicator 1 on the COT charts reflects the net position size of each category of traders.
Indicator 2 on the COT charts reflects the net position size for the non-commercial group.